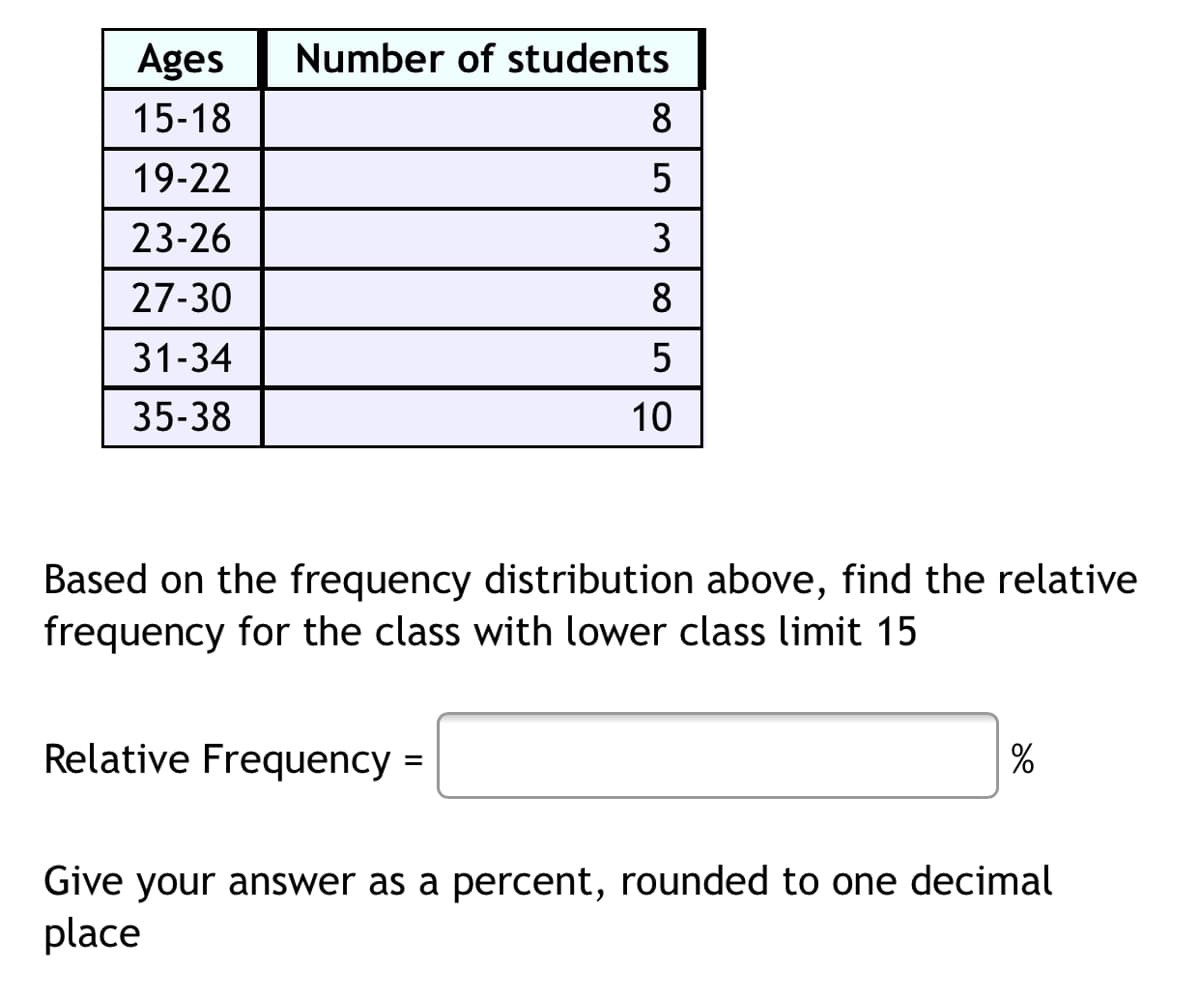
Ages Number of students 15-18 8 19-22 5 23-26 3 27-30 8 31-34 5 35-38 10 Based on the frequency distribution above, find the relative frequency for the class with lower class limit 15 Relative Frequency = % Give your answer as a percent, rounded to one decimal place


Q: . Identify the null hypothesis and the alternative hypothesis. Choose the correct answer below. A.…
A: Given that Sample size n =144 Favorable cases x =66 NOTE:- According to bartleby guidelines expert…
Q: When testing gas pumps for accuracy, fuel-quality enforcement specialists tested pumps and found…
A:
Q: A study was done to assess the effectiveness of Acceptance and Commitment Therapy for people with…
A: Given: Pre Post 21 15 24 15 21 17 26 20 32 17 Test-statistic = -4.16
Q: If Mc = 51 and ME = 43, for which situation is the 95% confidence interval for the difference…
A:
Q: E 19. In exercise 7 a sales manager collected the following data on x = annual sales and y = years…
A: A sales manager collected the data on annual sales and years of experience.
Q: In the following problem, check that it is appropriate to use the normal approximation to the…
A:
Q: Suppose you work for a large contracting company, and are responsible for managing the supply of…
A: Introduction: The true slope corresponding to the predictor x, the number of hours spent painting in…
Q: (a) TRUE or FALSE: The average household size in the whole city is between 2.16 and 2.44 with…
A: a) Confidence level=95% Degrees of freedom: 624(=625-1). Here, the population standard deviation is…
Q: Example 8.15 Suppose we have an urn containing ten balls of different colours such that 2 balls are…
A:
Q: Example 26.5 Suppose there is only one commodity where price in the base year is Rs 50 per unit and…
A:
Q: Directions: On the first blank, write the critical values based on the given information. Then, on…
A: Hey there! Thank you for posting the question. Since your question has more than 3 parts, we are…
Q: Identify which of the two variables are the independent x and dependent y variable for the…
A: We have given the following statement about the two variables.
Q: Given sp= 12.78 and N= 49, calculate sMD. SD
A: Solution-: Given: SD=12.78,N=49 We find sMD=?
Q: Example 20.2 Using the data given in Table 20.2, calculate the price index for year 2, the base year…
A:
Q: The mean amount of time it takes a kidney stone to pass is 14 days and the standard deviation is 6…
A: Given that Mean=14 Standard deviation=6
Q: Compute the Pearson correlation for the following data. Hours Spent Studying Per Week (X)…
A: The given data shows the hours of studying and GPA.
Q: part in a hearing experiment. Among other things, the absolute hearing threshold (in decibels) was…
A: A data set is given here By using frequency table we make histogram.
Q: In a large clinical trail, 396,234 children were randomly assigned to two groups. The treatment…
A: From the provided information, The treatment group consisted of 200,074 children given a vaccine for…
Q: 2. Ho: μ = 5.0 Ha: μ # 5.0 Critical Value: 3. Ho: μ = 67.5 Ha: H<67.5 Critical Value: 4. Ho: μ =…
A: Hi! Thank you for the question, as per the honor code, we are allowed to answer three sub-parts at a…
Q: Estimate the variance in mean mathematics SAT scores by state, using the randomly selected scores…
A:
Q: 2. A survey found that 73% of respondents currently have a job. Is 73% a statistic or a parameter?…
A: Given that Sample proportion p^=0.73 Parameter is based on population.
Q: You are a process engineer for a company that manufactures widgets. A particular machine at your…
A: In question, Given the 30.1% as a hypothesized proportion and then take a sample of size 315 with…
Q: You are analyzing a dataset containing 379 datapoints, and want to use 13 predictor variables to…
A: A multiple linear regression model is considered.
Q: This problem involves empirical probability. The table shows the breakdown of 91 thousand single…
A: Given data, P(Randomly selected is Female)=?
Q: Male(x₂) 80 83 78 84 90 88 82 85 89 82 85 12 86 Total Mean STEP 1: Make a hypothesis Ho: Ha: No 1 2…
A: We need to test, if there is any significant difference in the performance in Basic Calculus of the…
Q: Suppose you work as a researcher for a local anti-gambling advocacy group. You decide to conduct a…
A: We have given that, Average (x̄) = 39.64, sample size (n) = 29 and standard deviation (s) = 112.84…
Q: Suppose you an analyzing a large ANOVA test that yielded a F-statistic of 7.89 and a MSE of 249.97.…
A: Given: F-statistic =7.89 MSE=249.97
Q: Question: The p-value of a statistical test turns out to be about 2%. Which, if any, of the…
A: The p-value is the probability calculated to find evidence against the null hypo., assuming the null…
Q: Suppose you are a product engineer for a tool manufacturing company, and want to investigate the…
A: The number of new drill designs is 10 and the number of control groups is 1.
Q: During one shift, the express lane clerk recorded how many times customers violated the "10 items or…
A: ? is the most frequent number of over the limit items for this data set ? is the frequency of…
Q: 1. A company has a policy of retiring company cars; this policy looks at number of miles driven,…
A: As per guideline expert have to answer first question only dear student please upload other question…
Q: You are a sales manager for a grocery store, and you want to see if the introduction of a new sales…
A: Given that Sample sizes n1=12 , n2=17 Sample means x1=454.81 , x2=387.23
Q: A ship leaves port at noon and travels at a bearing of 214". The ship's average rate of speed is 15…
A:
Q: 1.79 Explain what each of the following sample correlation co- ww efficients tells you about the…
A: Here we have to define what following correlation coefficients tells about the relationship between…
Q: For Item 4-10, refer to the given data below. Data on distance traveled by 150 participants in the…
A: Given the data on distance traveled by 150 participants in the fund-raising marathon "Takbo Para sa…
Q: Suppose you are a product engineer for a tool manufacturing company, and want to investigate the…
A: The number of drill designs is 12 and the number of control groups is 1.
Q: Let X be the total medical expenses (in 1000s of dollars) incurred by a particular individual during…
A: Note: Hi there! Thank you for posting the question. As your question has more than 3 parts, we have…
Q: 3. Out of a lot of 40 televisions, only 3 are selected at random to be inspected for faults. How…
A:
Q: Customers at a gas station pay with a credit card (A), debit card (B), or cash (C). Assume that…
A:
Q: (b) The mean height of all adult American males is 69 inches (5 ft 9 in). A researcher wonders if…
A: Given that Sample size n =100 Sample mean =71 Population mean =69 NOTE:- According to bartleby…
Q: en, find the probability of selecting a married person. Marital Status, Ages 15 or Older, in…
A: Given Total number of adult men=124 Number of married men=69
Q: Are these samples independent or paired? Part 1 of 2 A sample of students is enrolled in a…
A: Two samples are said to paired if two observations are taken on same individual.
Q: You randomly select a card from a 52 card deck. Find the probability of selecting a 3 or 7.
A:
Q: Consider a drug that is used to help prevent blood clots in certain patients. In clinical trials,…
A: Given claim: 3% of users develop nausea. Null Hypothesis: H0: p=0.03 Alternative Hypothesis: H1: p…
Q: In a random sample of seven cell phones, the mean full retail price was $414.50 and the standard…
A: Given that Sample Mean \bar XXˉ = 414.50414.50 Sample Standard Deviation (s)(s) = 171171…
Q: Regular 24% 20% Decaf 20% 10% domly selecting such a is the probability that t
A: small medium large regular 0.24 0.2 0.16 decaf 0.2 0.1 0.1 for better understanding…
Q: Please use the accompanying Excel data set or accompanying Text file data set when completing the…
A: Given Information: Consider the given data: Stress Level Deflection 54 16.473 54 18.693 61…
Q: The life expectancy in the united states is 75 with a standard deviation of 7 years. A random sample…
A: As per our company guidelines we are supposed to answer only first 3 sub-parts. Kindly repost other…
Q: consider the normal standard deviation the mean is always------and the standard deviation is always
A: Let Z be the random variable from standard normal distribution with mean = 0 and standard deviation…
Q: Suppose you are analyzing a dataset of 76 datapoints investigating the relationship between the…
A: The question is based on residuals of the data. Given : Total no. of data points ( n ) = 76…

Step by step
Solved in 2 steps with 2 images

- random sample of 16 subjects The ages were: Assuming that age is normally distributed in the population, can we conclude that the mean age of the population is less than 60 years? Let α = 0.05.RELATIVE FREQUENCY DISTRIBUTION Use percentages to construct the relative frequency distribution corresponding to the accompanying frequency distribution for daily commute time in Boston.Categorical and Frequency Distribution
- Total plasma volume is important in determining the required plasma component in blood replacement therapy for a person undergoing surgery. Plasma volume is influenced by the overall health and physical activity of an individual. Suppose that a random sample of 42 male firefighters are tested and that they have a plasma volume sample mean of x = 37.5 ml/kg (milliliters plasma per kilogram body weight). Assume that σ = 8.00 ml/kg for the distribution of blood plasma. What conditions are necessary for your calculations? (Select all that apply.) σ is known the distribution of weights is norma lσ is unknown n is large the distribution of weights is uniformDescribing the sampling distribution of the sample means from an infinite population A population has a mean of 60 and a standard deviation of 5. A random sample of 16 measurements is drawn from this population. Describe the sample distribution of the sample means by computing its mean and standard deviation. With solutiondistribution of candidates who were enrolled for the mba entrace exam and the candidates (out of those enrolled) who passed the exam in different institutes CANDIDATES ENROLLED =8550 X-16%, P- 22%, Q-15%, R-10%, S-17%, T-8%, V-12% CANDIDATES PASSED= 5700 X- 12%, P-18%, Q-17%, R-13%, S-16%, T-9%, V-15% a) What is the percentage of candidates passed to the candidates enrolled for institutes Q and Rtogether?b) What is the ratio of candidates passed to the candidates enrolled from institute P?c)What makes the candidate fail the exam?
- Fertility Rates. From the U.S. Census Bureau, in the document International Data Base, we obtained data on the total fertility rates for women in various countries. Those data are presented on the WeissStats site. The total fertility rate gives the average number of children that would be born if all women in a given country lived to the end of their childbearing years and, at each year of age, they experienced the birth rates occurring in the specified year. Use the technology of your choice to decide whether total fertility rates for countries appear to be approximately normally distributed. Explain your answer.Ages Number of students 15-18 10 19-22 7 23-26 10 27-30 9 31-34 5 35-38 8 Based on the frequency distribution above, find the relative frequency for the class with a lower class limit of 27 Give your answer as a percent, rounded to 1 place after the decimal point, if necessary. Type only a number in the answer box (do NOT type "%" after your answer). Relative Frequency = % Submit1. Find the area of the shaded region. The graph to the right depicts IQ scores of adults, and those scores are normally distributed with a mean of 100 and a standard deviation of 15. 75 A graph with a bell-shaped curve, divided into 2 regions by a vertical line. The vertical line extends from the bell curve to the x-axis, and is located on the left half, under the curve. The region on the left of this line is shaded. The x-axis below the vertical line is labeled 75. Question content area bottom The area of the shaded region is enter your response here (Round to four decimal places as needed.) 2. Find the area of the shaded region. The graph to the right depicts IQ scores of adults, and those scores are normally distributed with a mean of 100 and a standard deviation of 15. 83 A symmetric bell-shaped curve is plotted over a horizontal scale. A vertical line runs from the…
- .59. Potatoes. A high-quality product is one that is consistent and has very little variability in its characteristics. Controlling variability can be more difficult with agricultural products than with those that are manufactured. The following table gives the weights, in ounces, of the 25 potatoes sold in a 10-pound bag. (a) Summarize the data graphically and numerically. Give reasons for the methods you chose to use in your summaries. (b) Do you think that your numerical summaries do an effective job of describing these data? Why or why not? (c) There appear to be two distinct clusters of weights for these potatoes. Divide the sample into two subsamples based on the clustering. Give the mean and standard deviation for each subsample. Do you think that this way of summarizing these data is better than a numerical summary that uses all the data as a single sample? Give a reason for your answer.Sampling and the Binomial Distribution. Refer to the discussion on the binomial approximation to the hypergeometric distribution. a. If sampling is with replacement, explain why the trials are independent and the success probability remains the same from trial to trial—always the proportion of the population that has the specified attribute. b. If sampling is without replacement, explain why the trials are not independent and the success probability varies from trial to trial.Sampling distribution of difference between two means is normally distributed. Explain with the help of an example
