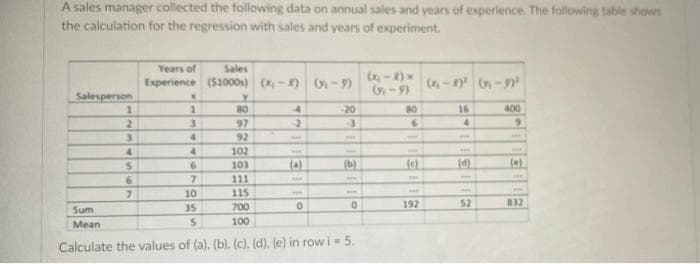
A sales manager collected the following data on annual sales and years of experience. The following table shows the calculation for the regression with sales and years of experiment. Salesperson Sum Mean 1 2 3 4 S 6 7 Years of Sales Experience (51000s) N 1 3 4 4 6 7 10 35 Y 80 97 92 102 103 (x,-) (-9) 4 -2 olie -20 3 (b) 111 115 700 5 100 (a) (b) (c) (d) (e) in row i 5 0 (-X)× (₁-9) -8 6 - (c) ww 192 (-8)¹6-9¹ 16 4 (d) 52 400 9 (0) www 832


Q: What are the capacity requirements for the next four years? (Assume that there is no learning.)…
A: Plastic sprinklers:1 machineCapacity 240,0005 workersTotal available capacity = 240,000 * 1 =…
Q: The main tool for managing the project scope, as described in PMBOK, is the O project charter O…
A:
Q: ng and supplying perspective and with a simple diagram describe how goods move from the supplier of…
A: Supply Chain management: Supply chain management is the enhancement of an item's creation and stream…
Q: how you feel Quality Improvement might be useful to a career path in the health care industry.
A: Ans) Quality Improvement can be a great career path in health care industry. Health care industry…
Q: Cal-Bus Mutual Funds, Inc. located in Pittsburgh. Cal-Bus just obtained $10,000,000 by converting…
A: Decision variables: B = Investment in B&E steel O = Investment in Oakland oil P = Investment in…
Q: a) GOT7 Soda Pop, Inc., has a new fruits drink. The production planner has assembled the following…
A: General notes : This is a case of aggregate plan with multiple possible answers based on the…
Q: 02. What should you ask and look for in trying to evaluate the veracity and usefulness of a…
A: Benefit-cost analysis: This can be defined as a systematic approach to decision-making regarding a…
Q: why and how companies should manage inventory level?
A: Inventory level:- The amount of inventory you have available across your whole distribution network…
Q: Problem 4: Given the following information, determine the number of Kanban cards required. Demand…
A: Production is the process in which inputs are combined to have the required output. It includes a…
Q: Explain the layout of production for a hotel’s interior and exterior and provide examples to support…
A: 1. Find your interior design focus.Keep this focus in mind as you choose your theme and general…
Q: Relate supply chain management to logistics, value chain concept, and value networks.
A: Supply chain management is described as the different kinds of practices, and actions that take…
Q: Problem 2:TRANSHIPMENT PROBLEM 500 Production Denver 800 Production Atlanta 3 2 4.5 2.5 3-5 Kansas…
A: Given data in tabular form.
Q: you guarantee the product's quality after it has been manufact m other outsources arrive at your…
A: It's common parlance to discuss the "quality" of almost every product we use on a daily basis,…
Q: Why do you think project needs assessment is useful to developing a project?
A: Any project will have some specific needs in its initial stage and fulfilling those needs is…
Q: Which one is the stronger thesis statement? Watch out for thesis statements that are too general,…
A: a) this is not thesis.Thesis is a essay or dissertation involving personal research and based on…
Q: Which of the following terms is used to describe the process of monitoring operating results and…
A: Project monitoring is described as means through which an entire project can be tracked and…
Q: A recent college graduate is planning to move cross country from her college town to the city where…
A: 1. This is an integer programming model requiring binary variables.
Q: Janelle Heinke, the owner of Ha'Peppas!, is considering a new oven in which to bake the firm's…
A: Given Data For the oven A Fixed cost = $20,000 Variable cost = $2.00 Oven A type can handle 20…
Q: Note: This problem requires Excel. A firm offers two different prices on its products, depending…
A: Let, P1 = Number of units of product 1 to be produced Q1 = Number of units of product 1 to be…
Q: Colombo Coffee Co is the ultimate coffee shop based in Durban North, has everything a coffee lover…
A: Colombo Coffee Co is the ultimate coffee shop based in Durban North, has everything a coffee lover…
Q: A manager wants to choose one of two forecasting alternatives: moving average and exponential…
A: Given data is
Q: 3- For the following test marketing project at week 6: a. Ignore the far right “% Complete” column…
A: Activity Predecessor Duration Budget Actual cost % complete a - 2 300 400 100 b - 3 200 180 100…
Q: By finding the appropriate productivity indices, answer the following questions: Which store…
A: Productivity is the relationship between the volume of the input and output that is calculated in…
Q: EX: 1.9 Given the estimated activity times below and the network refer to the table and network…
A: A network diagram related to the project shows the sequence of the task that is performed to…
Q: hovo uses the ZX-81 chip in some of its laptop computers. The prices for the chip during the last 12…
A: a) b)
Q: Discuss the need to manage inventory in the monetary context.
A: Inventory is one of the most vital elements of any business model. A close tab on the passage of…
Q: Formulate an LP model for the following problems. 1. A furniture company makes two products: book…
A: Decision Variables: Suppose - x be the no. of bookshelves that the furniture company will…
Q: Calculate the annual economic order quantity from the information provided below.
A: EOQ stands for economic order quantity. It is a company's optimal order quantity that undervalues…
Q: In the welding operations of a bicycle manufacturer, a bike frame has a flow time of about 12.75…
A: The detailed solution is given in Step 2.
Q: At the Strathmore University Cafeteria, students seeking to have a meal are observed to arrive at a…
A: Given, Arrival rate, λ =16 per 20 minutes =0.8 per minute Service rate, μ =19 per 20 minutes =0.95…
Q: What are the key considerations when developing a facility operation and maintenance plan?
A: Facilities operations, as well as maintenance plan, include a wide range of services, skills,…
Q: C&A Furniture uses a four-step process to make its famous wood table: Process Milling Table top…
A: Processing time is the time in which raw materials are transformed into finished products for the…
Q: Course: Project management Identify the different stages of a project job cycle
A: A project management life cycle is a process with different stages like initiating, planning,…
Q: how many days, are required for each refinery to operate to obtain the minimum cost?
A: Linear programming is a mathematical technique that is also used in operations management…
Q: Question ONE Consider the narrative below and use it to answer the questions that will follow: At…
A:
Q: Using trend-adjusted exponential smoothing, Forecasts (F₂), Trend (T₂), and Forecasts Including…
A: Forecasting is a technique used to predict future outcomes on the basis of past data. In businesses…
Q: What is the amout ordered each week? What is the minimum required per gal?
A: Linear programming is a mathematical technique that is commonly used in operations management…
Q: Use the following information to compute a single exponential smoothing model forecast with a…
A: From the above information, Let, Forecast for period 1 =f1 =115 Actual value for period 1 =a1…
Q: What is the total cost for this project? (question a)iv.)
A: A network diagram related to the project shows the sequence of the task that is performed to…
Q: discuss the importance of work measurement.
A: Introduction Work Measurement in Operation Management can be define as the technique which performs…
Q: 2 Vidhya Balan is planning to liquidate her investments in mutual funds and invest in real estate.…
A: Find the Given details below: Given details: Month Average Fund Price 1 55.1 2 53.8 3…
Q: What can purchasing do to implement just in time deliveries?
A: The just-in-time often called the JIT inventory system can be stated as the management strategy that…
Q: For the Orlando real estate investment problem, assume the probabilities for the gasoline shortage,…
A: Given data is
Q: 16. Backward integration is achieved through a. A coalition of the firm's suppliers. b. The purchase…
A: Backward integration generally occurs when the organization wishes to obtain complete control over…
Q: The state-of-nature probabilities are P(S₁) = 0.35, P(S₂) = 0.35, and P(S3) = 0.30. a. Use a…
A: A decision tree is a diagram that shows all of the possible outcomes of a decision and the…
Q: At the British Grand Prix’s Silverstone Circuit’s 3 July 2022 race, it was another battle royal of…
A: Arrival rate λ 2048 per hour Service rate µ 533 per 14 minutes Gallery capacity = 150,000…
Q: Enumerate and explain five different supply chain trends and how they will affect the hospitality…
A: Hospitality industry:- The hospitality sector can be characterised as a business that offers…
Q: Annual demand is 7,000 units; Carrying cost is $4 per unit; Economic Order Quantity is 1,000 units;…
A: Carrying cost is the money incurred by the company for storing the goods in inventory for a period…
Q: Herlich is planning to launch a new crochet product online. The following table depicts the project…
A: A network diagram is a visual representation of a project which helps to identify the activity…
Q: The product vision or features are unclear. Product owners are permitted to change requirements and…
A: Project methodology- Different projects come with different requirements to achieve their particular…

Step by step
Solved in 3 steps with 4 images

- An antique collector believes that the price received for a particular item increases with its age and with the number of bidders. The file P13_14.xlsx contains data on these three variables for 32 recently auctioned comparable items. Estimate a multiple regression equation using the given data. Interpret each of the estimated regression coefficients. Is the antique collector correct in believing that the price received for the item increases with its age and with the number of bidders? Interpret the standard error of estimate and the R-square value for these data.A small computer chip manufacturer wants to forecast monthly ozperating costs as a function of the number of units produced during a month. The company has collected the 16 months of data in the file P13_34.xlsx. a. Determine an equation that can be used to predict monthly production costs from units produced. Are there any outliers? b. How could the regression line obtained in part a be used to determine whether the company was efficient or inefficient during any particular month?Management of a home appliance store would like to understand the growth pattern of the monthly sales of Blu-ray disc players over the past two years. Managers have recorded the relevant data in the file P13_33.xlsx. a. Create a scatterplot for these data. Comment on the observed behavior of monthly sales at this store over time. b. Estimate an appropriate regression equation to explain the variation of monthly sales over the given time period. Interpret the estimated regression coefficients. c. Analyze the estimated equations residuals. Do they suggest that the regression equation is adequate? If not, return to part b and revise your equation. Continue to revise the equation until the results are satisfactory.
- The management of a technology company is trying to determine the variable that best explains the variation of employee salaries using a sample of 52 full-time employees; see the file P13_08.xlsx. Estimate simple linear regression equations to identify which of the following has the strongest linear relationship with annual salary: the employees gender, age, number of years of relevant work experience prior to employment at the company, number of years of employment at the company, or number of years of post secondary education. Provide support for your conclusion.The Baker Company wants to develop a budget to predict how overhead costs vary with activity levels. Management is trying to decide whether direct labor hours (DLH) or units produced is the better measure of activity for the firm. Monthly data for the preceding 24 months appear in the file P13_40.xlsx. Use regression analysis to determine which measure, DLH or Units (or both), should be used for the budget. How would the regression equation be used to obtain the budget for the firms overhead costs?Stock market analysts are continually looking for reliable predictors of stock prices. Consider the problem of modeling the price per share of electric utility stocks (Y). Two variables thought to influence this stock price are return on average equity (X1) and annual dividend rate (X2). The stock price, returns on equity, and dividend rates on a randomly selected day for 16 electric utility stocks are provided in the file P13_15.xlsx. Estimate a multiple regression equation using the given data. Interpret each of the estimated regression coefficients. Also, interpret the standard error of estimate and the R-square value for these data.
- Suppose that a regional express delivery service company wants to estimate the cost of shipping a package (Y) as a function of cargo type, where cargo type includes the following possibilities: fragile, semifragile, and durable. Costs for 15 randomly chosen packages of approximately the same weight and same distance shipped, but of different cargo types, are provided in the file P13_16.xlsx. a. Estimate a regression equation using the given sample data, and interpret the estimated regression coefficients. b. According to the estimated regression equation, which cargo type is the most costly to ship? Which cargo type is the least costly to ship? c. How well does the estimated equation fit the given sample data? How might the fit be improved? d. Given the estimated regression equation, predict the cost of shipping a package with semifragile cargo.The file P13_02.xlsx contains five years of monthly data on sales (number of units sold) for a particular company. The company suspects that except for random noise, its sales are growing by a constant percentage each month and will continue to do so for at least the near future. a. Explain briefly whether the plot of the series visually supports the companys suspicion. b. By what percentage are sales increasing each month? c. What is the MAPE for the forecast model in part b? In words, what does it measure? Considering its magnitude, does the model seem to be doing a good job? d. In words, how does the model make forecasts for future months? Specifically, given the forecast value for the last month in the data set, what simple arithmetic could you use to obtain forecasts for the next few months?The owner of a restaurant in Bloomington, Indiana, has recorded sales data for the past 19 years. He has also recorded data on potentially relevant variables. The data are listed in the file P13_17.xlsx. a. Estimate a simple regression equation involving annual sales (the dependent variable) and the size of the population residing within 10 miles of the restaurant (the explanatory variable). Interpret R-square for this regression. b. Add another explanatory variableannual advertising expendituresto the regression equation in part a. Estimate and interpret this expanded equation. How does the R-square value for this multiple regression equation compare to that of the simple regression equation estimated in part a? Explain any difference between the two R-square values. How can you use the adjusted R-squares for a comparison of the two equations? c. Add one more explanatory variable to the multiple regression equation estimated in part b. In particular, estimate and interpret the coefficients of a multiple regression equation that includes the previous years advertising expenditure. How does the inclusion of this third explanatory variable affect the R-square, compared to the corresponding values for the equation of part b? Explain any changes in this value. What does the adjusted R-square for the new equation tell you?
- Do the sales prices of houses in a given community vary systematically with their sizes (as measured in square feet)? Answer this question by estimating a simple regression equation where the sales price of the house is the dependent variable, and the size of the house is the explanatory variable. Use the sample data given in P13_06.xlsx. Interpret your estimated equation, the associated R-square value, and the associated standard error of estimate.The file P14_01.xlsx contains data on 100 consumers who drink beer. Some of them prefer light beer, and others prefer regular beer. A major beer producer believes that the following variables might be useful in discriminating between these two groups: gender, marital status, annual income level, and age. a. Use logistic regression to classify the consumers on the basis of these explanatory variables. How successful is it? Which variables appear to be most important in the classification? b. Consider a new customer: Male, Married, Income 42,000, Age 47. Use the logistic regression equation to estimate the probability that this customer prefers Regular. How would you classify this person?Management of a home appliance store wants to understand the growth pattern of the monthly sales of a new technology device over the past two years. The managers have recorded the relevant data in the file P13_05.xlsx. Have the sales of this device been growing linearly over the past 24 months? By examining the results of a linear trend line, explain why or why not.