a sample mean of 2,4 iation of 760.8 square fee 8 had a sămple mean of eviation of 730.2 square for the square footages Using a = 0.05, perform age home constructed in nd construct a 95% confie ce in the square footages two years. Interpret your tv N MacBook Pro
a sample mean of 2,4 iation of 760.8 square fee 8 had a sămple mean of eviation of 730.2 square for the square footages Using a = 0.05, perform age home constructed in nd construct a 95% confie ce in the square footages two years. Interpret your tv N MacBook Pro

Glencoe Algebra 1, Student Edition, 9780079039897, 0079039898, 2018
18th Edition
ISBN:9780079039897
Author:Carter
Publisher:Carter
Chapter10: Statistics
Section10.4: Distributions Of Data
Problem 19PFA

Related questions

Question
Transcribed Image Text:v A A
Aa v
A
v O v A v
Styles Styles
Pane
Dictate
Edito
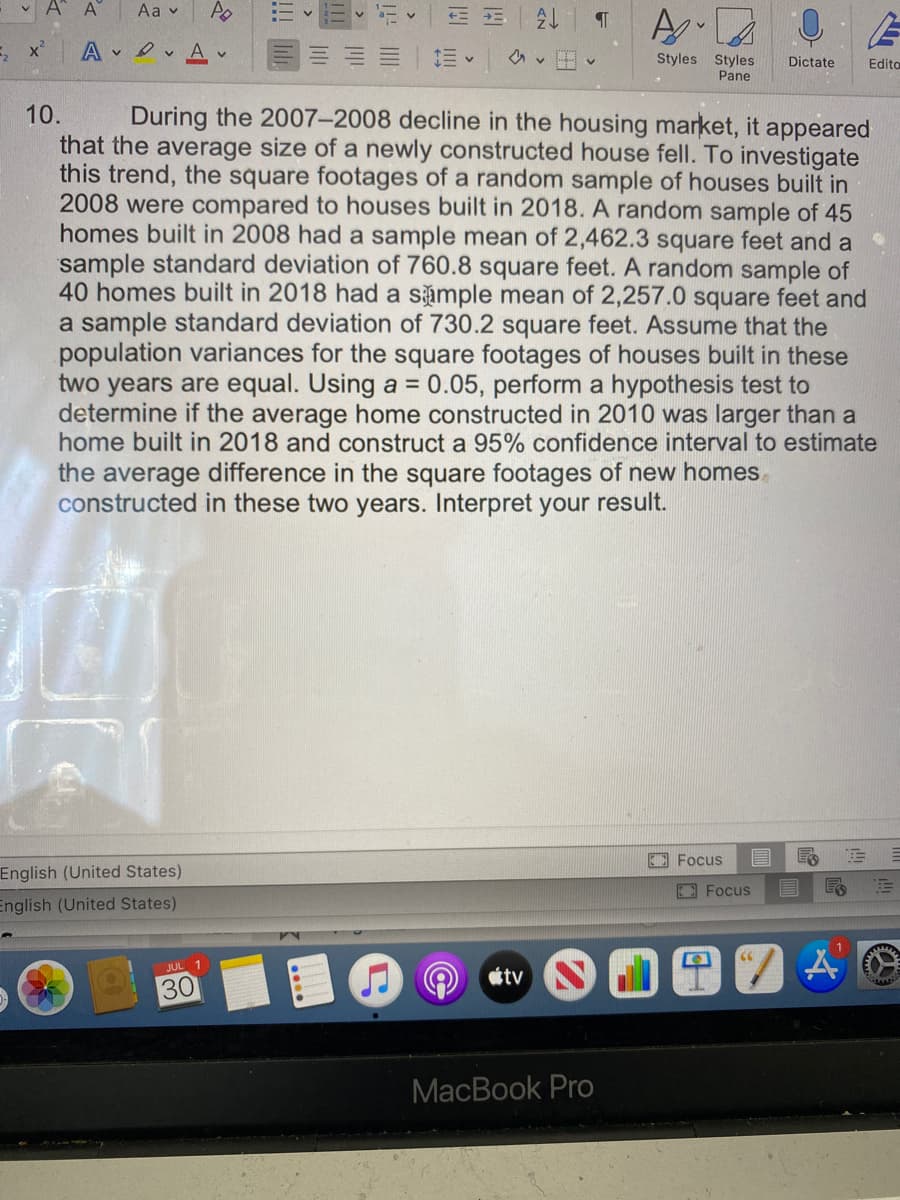
During the 2007–2008 decline in the housing market, it appeared
that the average size of a newly constructed house fell. To investigate
this trend, the square footages of a random sample of houses built in
2008 were compared to houses built in 2018. A random sample of 45
homes built in 2008 had a sample mean of 2,462.3 square feet and a
sample standard deviation of 760.8 square feet. A random sample of
40 homes built in 2018 had a sámple mean of 2,257.0 square feet and
a sample standard deviation of 730.2 square feet. Assume that the
population variances for the square footages of houses built in these
two years are equal. Using a = 0.05, perform a hypothesis test to
determine if the average home constructed in 2010 was larger than a
home built in 2018 and construct a 95% confidence interval to estimate
10.
the average difference in the square footages of new homes
constructed in these two years. Interpret your result.
EE Focus
English (United States)
E Focus
English (United States)
66
JUL 1
tv
30
МacВook Pro
Expert Solution
This question has been solved!
Explore an expertly crafted, step-by-step solution for a thorough understanding of key concepts.

Step by step
Solved in 3 steps with 1 images

Knowledge Booster


Learn more about
Need a deep-dive on the concept behind this application? Look no further. Learn more about this topic, statistics and related others by exploring similar questions and additional content below.Recommended textbooks for you
Glencoe Algebra 1, Student Edition, 9780079039897…
Algebra
ISBN:
9780079039897
Author:
Carter
Publisher:
McGraw Hill
Glencoe Algebra 1, Student Edition, 9780079039897…
Algebra
ISBN:
9780079039897
Author:
Carter
Publisher:
McGraw Hill