A sample mean, sample size, and sample standard deviation are provided below. Use the one-mean t-test to perform the required hypothesis test at the 10% significance leve x = 27, s = 10, n = 24, Ho: µ = 28, Ha: µ<28 E Click here to view a partial table of values of ta.
A sample mean, sample size, and sample standard deviation are provided below. Use the one-mean t-test to perform the required hypothesis test at the 10% significance leve x = 27, s = 10, n = 24, Ho: µ = 28, Ha: µ<28 E Click here to view a partial table of values of ta.

MATLAB: An Introduction with Applications
6th Edition
ISBN:9781119256830
Author:Amos Gilat
Publisher:Amos Gilat
Chapter1: Starting With Matlab
Section: Chapter Questions
Problem 1P

Related questions
Topic Video
Question
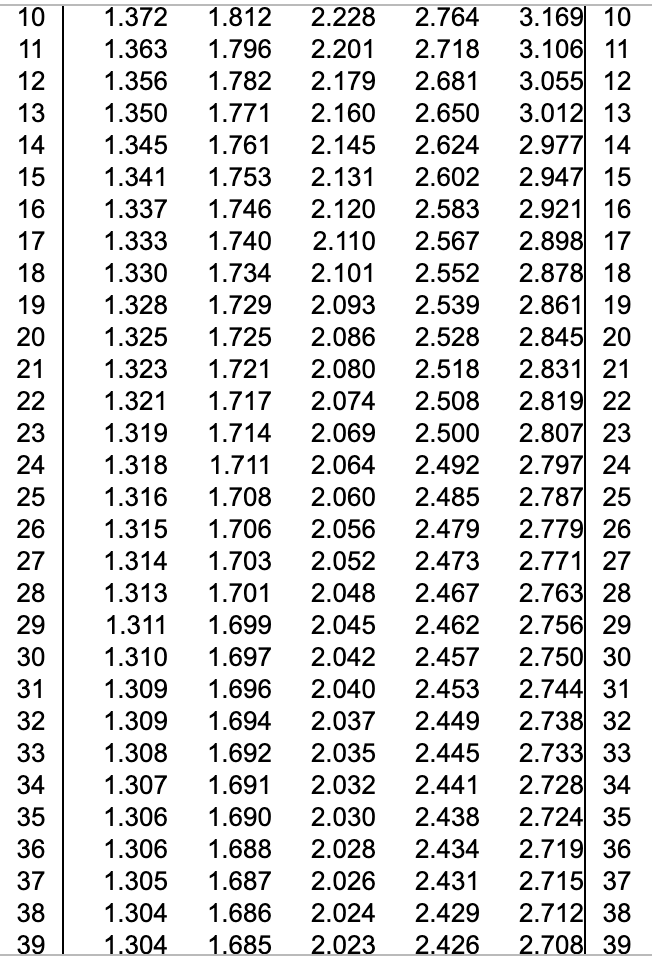
Transcribed Image Text:3.169 10
3.106 11
3.055 12
3.012 13
2.977 14
2.947 15
2.921 16
2.898 17
2.878 18
2.861 19
2.845 20
2.831 21
2.819 22
2.807 23
2.797 24
2.787 25
2.779 26
2.771 27
2.763 28
2.756 29
2.750 30
2.744 31
2.738 32
2.733 33
2.728 34
2.724 35
2.719 36
2.715 37
2.712 38
2.708 39
10
1.372
1.812
2.228
2.764
11
1.363
1.796
2.201
2.718
12
1.356
1.782
2.179
2.681
13
1.350
1.771
2.160
2.650
14
1.345
1.761
2.145
2.624
15
1.341
1.753
2.131
2.602
16
1.337
1.746
2.120
2.583
17
1.333
1.740
2.110
2.567
18
1.330
1.734
2.101
2.552
19
1.328
1.729
2.093
2.539
20
1.325
1.725
2.086
2.528
21
1.323
1.721
2.080
2.518
22
1.321
1.717
2.074
2.508
23
1.319
1.714
2.069
2.500
24
1.318
1.711
2.064
2.492
25
1.316
1.708
2.060
2.485
26
1.315
1.706
2.056
2.479
27
1.314
1.703
2.052
2.473
28
1.313
1.701
2.048
2.467
29
1.311
1.699
2.045
2.462
30
1.310
1.697
2.042
2.457
31
1.309
1.696
2.040
2.453
32
1.309
1.694
2.037
2.449
33
1.308
1.692
2.035
2.445
2.032
2.030
34
1.307
1.691
2.441
35
1.306
1.690
2.438
36
1.306
1.688
2.028
2.434
37
1.305
1.687
2.026
2.431
38
1.304
1.686
2.024
2.429
39
1.304
1.685
2.023
2.426
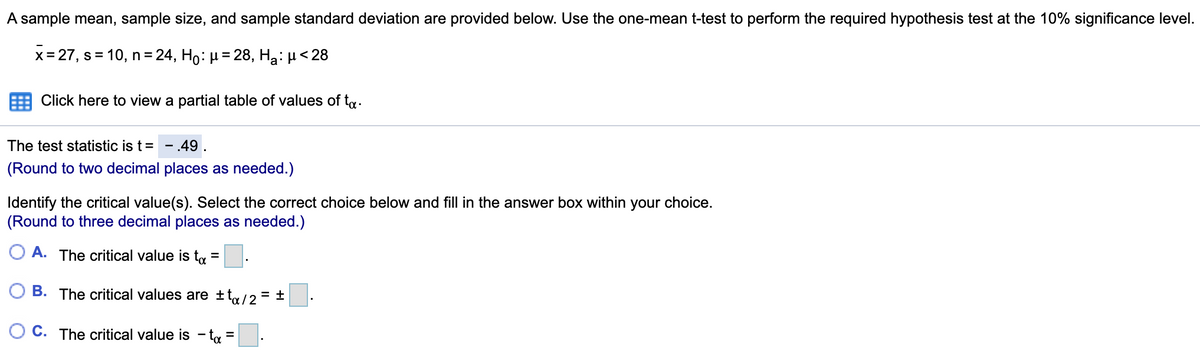
Transcribed Image Text:A sample mean, sample size, and sample standard deviation are provided below. Use the one-mean t-test to perform the required hypothesis test at the 10% significance level.
x= 27, s= 10, n = 24, Ho: µ= 28, Ha: µ<28
%3D
Click here to view a partial table of values of ta.
The test statistic is t=
.49.
(Round to two decimal places as needed.)
Identify the critical value(s). Select the correct choice below and fill in the answer box within your choice.
(Round to three decimal places as needed.)
O A. The critical value is ta =
B. The critical values are ±t/2= ±
C. The critical value is - ta =:
Expert Solution
This question has been solved!
Explore an expertly crafted, step-by-step solution for a thorough understanding of key concepts.

This is a popular solution!

Trending now
This is a popular solution!

Step by step
Solved in 2 steps

Knowledge Booster


Learn more about
Need a deep-dive on the concept behind this application? Look no further. Learn more about this topic, statistics and related others by exploring similar questions and additional content below.Recommended textbooks for you
MATLAB: An Introduction with Applications
Statistics
ISBN:
9781119256830
Author:
Amos Gilat
Publisher:
John Wiley & Sons Inc

Probability and Statistics for Engineering and th…
Statistics
ISBN:
9781305251809
Author:
Jay L. Devore
Publisher:
Cengage Learning

Statistics for The Behavioral Sciences (MindTap C…
Statistics
ISBN:
9781305504912
Author:
Frederick J Gravetter, Larry B. Wallnau
Publisher:
Cengage Learning
MATLAB: An Introduction with Applications
Statistics
ISBN:
9781119256830
Author:
Amos Gilat
Publisher:
John Wiley & Sons Inc
Probability and Statistics for Engineering and th…
Statistics
ISBN:
9781305251809
Author:
Jay L. Devore
Publisher:
Cengage Learning
Statistics for The Behavioral Sciences (MindTap C…
Statistics
ISBN:
9781305504912
Author:
Frederick J Gravetter, Larry B. Wallnau
Publisher:
Cengage Learning

Elementary Statistics: Picturing the World (7th E…
Statistics
ISBN:
9780134683416
Author:
Ron Larson, Betsy Farber
Publisher:
PEARSON

The Basic Practice of Statistics
Statistics
ISBN:
9781319042578
Author:
David S. Moore, William I. Notz, Michael A. Fligner
Publisher:
W. H. Freeman

Introduction to the Practice of Statistics
Statistics
ISBN:
9781319013387
Author:
David S. Moore, George P. McCabe, Bruce A. Craig
Publisher:
W. H. Freeman