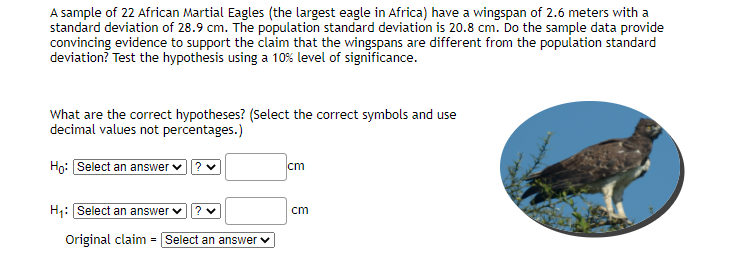
A sample of 22 African Martial Eagles (the largest eagle in Africa) have a wingspan of 2.6 meters with a standard deviation of 28.9 cm. The population standard deviation is 20.8 cm. Do the sample data provide convincing evidence to support the claim that the wingspans are different from the population standard deviation? Test the hypothesis using a 10% level of significance.
A sample of 22 African Martial Eagles (the largest eagle in Africa) have a wingspan of 2.6 meters with a standard deviation of 28.9 cm. The population standard deviation is 20.8 cm. Do the sample data provide convincing evidence to support the claim that the wingspans are different from the population standard deviation? Test the hypothesis using a 10% level of significance.

MATLAB: An Introduction with Applications
6th Edition
ISBN:9781119256830
Author:Amos Gilat
Publisher:Amos Gilat
Chapter1: Starting With Matlab
Section: Chapter Questions
Problem 1P

Related questions
Topic Video
Question
Transcribed Image Text:A sample of 22 African Martial Eagles (the largest eagle in Africa) have a wingspan of 2.6 meters with a
standard deviation of 28.9 cm. The population standard deviation is 20.8 cm. Do the sample data provide
convincing evidence to support the claim that the wingspans are different from the population standard
deviation? Test the hypothesis using a 10% level of significance.
What are the correct hypotheses? (Select the correct symbols and use
decimal values not percentages.)
Họ: Select an answer
cm
H:Select an answer v? v
cm
Original claim = Select an answer v
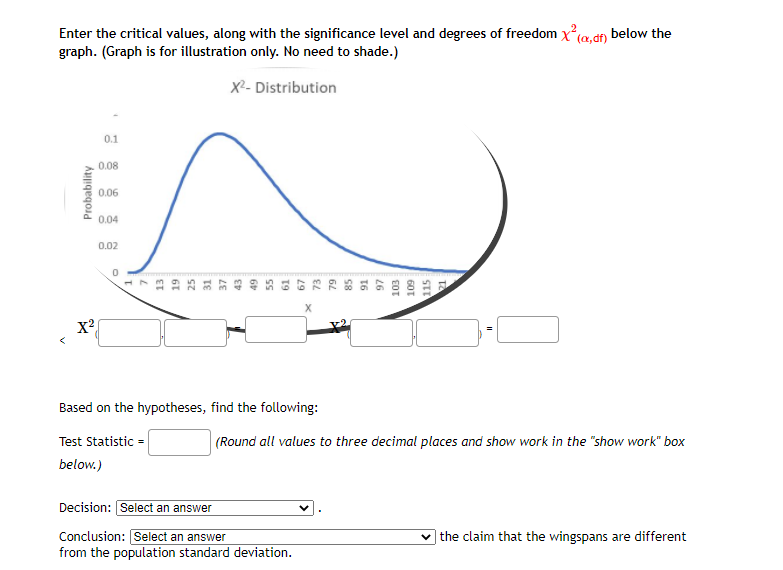
Transcribed Image Text:Enter the critical values, along with the significance level and degrees of freedom x(a, df)
graph. (Graph is for illustration only. No need to shade.)
below the
X2- Distribution
0.1
0.08
0.06
0.04
0.02
Based on the hypotheses, find the following:
Test Statistic
(Round all values to three decimal places and show work in the "show work" box
below.)
Decision: Select an answer
Conclusion: Select an answer
from the population standard deviation.
| the claim that the wingspans are different
Probability
103
60T
115
Expert Solution
This question has been solved!
Explore an expertly crafted, step-by-step solution for a thorough understanding of key concepts.

This is a popular solution!

Trending now
This is a popular solution!

Step by step
Solved in 2 steps with 1 images

Knowledge Booster


Learn more about
Need a deep-dive on the concept behind this application? Look no further. Learn more about this topic, statistics and related others by exploring similar questions and additional content below.Recommended textbooks for you
MATLAB: An Introduction with Applications
Statistics
ISBN:
9781119256830
Author:
Amos Gilat
Publisher:
John Wiley & Sons Inc

Probability and Statistics for Engineering and th…
Statistics
ISBN:
9781305251809
Author:
Jay L. Devore
Publisher:
Cengage Learning

Statistics for The Behavioral Sciences (MindTap C…
Statistics
ISBN:
9781305504912
Author:
Frederick J Gravetter, Larry B. Wallnau
Publisher:
Cengage Learning
MATLAB: An Introduction with Applications
Statistics
ISBN:
9781119256830
Author:
Amos Gilat
Publisher:
John Wiley & Sons Inc
Probability and Statistics for Engineering and th…
Statistics
ISBN:
9781305251809
Author:
Jay L. Devore
Publisher:
Cengage Learning
Statistics for The Behavioral Sciences (MindTap C…
Statistics
ISBN:
9781305504912
Author:
Frederick J Gravetter, Larry B. Wallnau
Publisher:
Cengage Learning

Elementary Statistics: Picturing the World (7th E…
Statistics
ISBN:
9780134683416
Author:
Ron Larson, Betsy Farber
Publisher:
PEARSON

The Basic Practice of Statistics
Statistics
ISBN:
9781319042578
Author:
David S. Moore, William I. Notz, Michael A. Fligner
Publisher:
W. H. Freeman

Introduction to the Practice of Statistics
Statistics
ISBN:
9781319013387
Author:
David S. Moore, George P. McCabe, Bruce A. Craig
Publisher:
W. H. Freeman