A sample of 750 children treated for injuries sustained from motor vehicle accidents was obtained, and each child was classified according to (1) ethnic background (English Speaking Background (ESB) or Non-English Speaking Background (NESB)) and (2) seat belt usage (worn or not worn) during the accident. The number of children in each category is given in the table below. NESB ESB Seat belts worn 40 150 Seat belts not worn 240 320 a) In the following table, fill in the missing expected frequency. Show all working. Expected frequencies NESB ESB Seat belts worn 70.93333 119.0667 Seat belts not worn 350.9333 b) Which hypothesis has to be true in order that the frequencies calculated above actually are the expected frequencies? c) We wish to conduct an appropriate hypothesis test at the 1% level of significance to determine whether the use of seat belts in motor vehicles depends on ethnic background. If the calculated test statistic is 28.83 and the critical value is 6.6349, do we reject or retain the null hypothesis? Interpret the results in contextual terms.
A sample of 750 children treated for injuries sustained from motor vehicle accidents was obtained, and each child was classified according to (1) ethnic background (English Speaking Background (ESB) or Non-English Speaking Background (NESB)) and (2) seat belt usage (worn or not worn) during the accident. The number of children in each category is given in the table below. NESB ESB Seat belts worn 40 150 Seat belts not worn 240 320 a) In the following table, fill in the missing expected frequency. Show all working. Expected frequencies NESB ESB Seat belts worn 70.93333 119.0667 Seat belts not worn 350.9333 b) Which hypothesis has to be true in order that the frequencies calculated above actually are the expected frequencies? c) We wish to conduct an appropriate hypothesis test at the 1% level of significance to determine whether the use of seat belts in motor vehicles depends on ethnic background. If the calculated test statistic is 28.83 and the critical value is 6.6349, do we reject or retain the null hypothesis? Interpret the results in contextual terms.

Holt Mcdougal Larson Pre-algebra: Student Edition 2012
1st Edition
ISBN:9780547587776
Author:HOLT MCDOUGAL
Publisher:HOLT MCDOUGAL
Chapter11: Data Analysis And Probability
Section11.5: Interpreting Data
Problem 1C

Related questions
Question
Answer this question
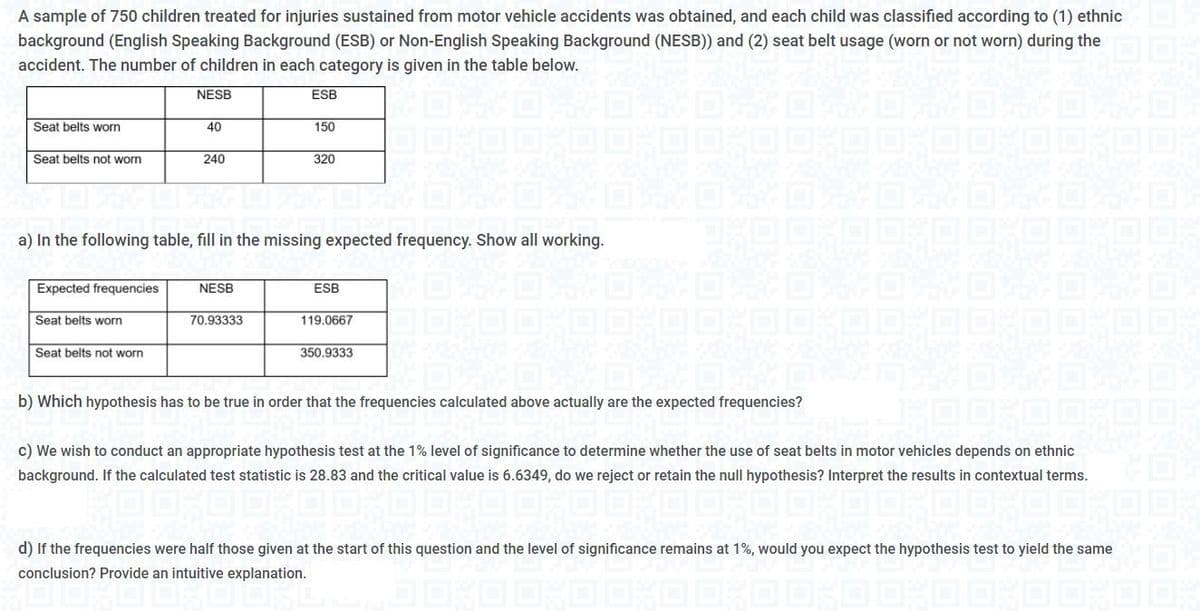
Transcribed Image Text:A sample of 750 children treated for injuries sustained from motor vehicle accidents was obtained, and each child was classified according to (1) ethnic
background (English Speaking Background (ESB) or Non-English Speaking Background (NESB)) and (2) seat belt usage (worn or not worn) during the
accident. The number of children in each category is given in the table below.
NESB
ESB
Seat belts worn
40
150
Seat belts not worn
240
320
a) In the following table, fill in the missing expected frequency. Show all working.
Expected frequencies
NESB
ESB
Seat belts worn
70.93333
119.0667
Seat belts not worn
350.9333
b) Which hypothesis has to be true in order that the frequencies calculated above actually are the expected frequencies?
c) We wish to conduct an appropriate hypothesis test at the 1% level of significance to determine whether the use of seat belts in motor vehicles depends on ethnic
background. If the calculated test statistic is 28.83 and the critical value is 6.6349, do we reject or retain the null hypothesis? Interpret the results in contextual terms.
d) If the frequencies were half those given at the start of this question and the level of significance remains at 1%, would you expect the hypothesis test to yield the same
conclusion? Provide an intuitive explanation.
Expert Solution
This question has been solved!
Explore an expertly crafted, step-by-step solution for a thorough understanding of key concepts.

Step by step
Solved in 2 steps

Knowledge Booster


Learn more about
Need a deep-dive on the concept behind this application? Look no further. Learn more about this topic, statistics and related others by exploring similar questions and additional content below.Recommended textbooks for you
Holt Mcdougal Larson Pre-algebra: Student Edition…
Algebra
ISBN:
9780547587776
Author:
HOLT MCDOUGAL
Publisher:
HOLT MCDOUGAL
Holt Mcdougal Larson Pre-algebra: Student Edition…
Algebra
ISBN:
9780547587776
Author:
HOLT MCDOUGAL
Publisher:
HOLT MCDOUGAL