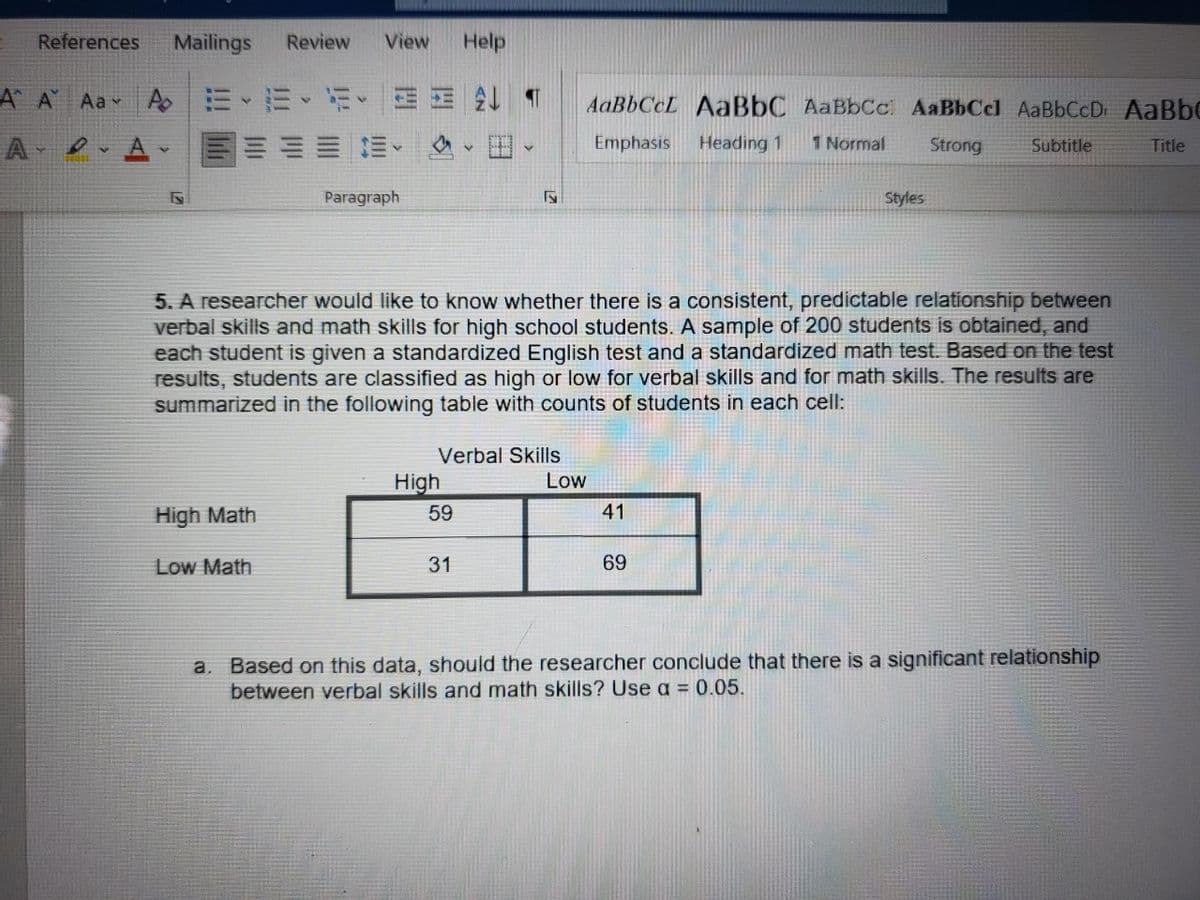
5. A researcher would like to know whether there is a consistent, predictable relationship between verbal skills and math skills for high school students. A sample of 200 students is obtained, and each student is given a standardized English test and a standardized math test. Based on the test results, students are classified as high or low for verbal skills and for math skills. The results are summarized in the following table with counts of students in each cell: Verbal Skills High Low High Math 59 41 Low Math 31 69 a. Based on this data, should the researcher conclude that there is a significant relationship between verbal skills and math skills? Use a = 0.05.
Q: The Ministry of Health reported the number of reported cases of all stages of syphilis for two…
A: Given information- We have given the number of reported cases of syphilis for two regions for the…
Q: Study is conducted involving 14 infants to investigate the association between gestational age at…
A: Correlation is used to find the association between two variables which can be obtained using excel…
Q: 1. A teacher wants to find out if it is true that students who are good in math are not that good in…
A: 1) The Pearson correlation coefficient and its test of significance is used to find the relationship…
Q: A researcher randomly selected 100 adults aged 18-25 and 100 adults aged 50-60. Within each age…
A: Given, A researcher randomly selected 100 adults aged 18-25 and 100 adults aged 50-60. Within each…
Q: 8. A market investigator returns the following' data. Of 1,000 people consulted 811 liked…
A:
Q: The following data comes from a hypothetical survey of 920 people (Men,Women) that ask for their…
A:
Q: 1. The following table gives us a summary of patients who went into the ICU at Bay State Medical…
A: Introduction - Chi square test χ2=∑(Oi-Ei)2EiWhere,χ2=Chi squared Oi=Observed value Ei=Expected…
Q: Based on a survey of 12,344 U.S. college students and 6,729 Canadian college students, Kuo, Adlaf,…
A: Introduction: A survey research design is a design in research, where the researcher conducts a…
Q: 33 were using Program 1, Program 2, and Program 3 to improve their fitness. 55 were using Program…
A:
Q: The following data includes the year, make, model, mileage (in thousands of miles) and asking price…
A: Step-by-step procedure to find the sample correlation coefficient using Excel: In Excel sheet,…
Q: The following data includes the year, make, model, mileage (in thousands of miles) and asking price…
A: Formula for correlation coefficient: From the given information,
Q: A problem with a phone line that prevents a customer from receiving or making calls is upsetting to…
A: Since you have posted a question with multiple sub-parts, we will solve first three sub- parts for…
Q: A researcher is interested in investigating whether the military branch a person signs up for and…
A:
Q: 4. A mathematics placement test is given to all entering freshmen at a small college. A student who…
A: For the given data graph the estimated regression line
Q: A sociologist claims that as the per capita personal income of a state increases, the birt rate…
A: From the given information, Per capita personal income Birth Rate Rank(per capita income)…
Q: A study published in the American Journal of Public Health was conducted to determine whether the…
A: From the given information we calculate chi squared test statistics.
Q: An article reported the estimated percentage of U.S. households with only wireless phone service (no…
A: Construct a comparative boxplot for the given data: The data represents the wireless percent for 3…
Q: A problem with a phone line that prevents a customer from receiving or making calls is upsetting to…
A: Solution Given data West Office East Office 1.52 4.55 1.75 3.75 0.78 0.10 2.85 1.10…
Q: 10.24 The question of whether the sexual orientation of the mother has an impact on the sexual…
A: a) The populations of interest in this study is lesbian mothers and heterosexual single mothers.
Q: 1) A research institute is asking a pool of 120 people belonging to three economic sectors their…
A: Given: Opinion Agriculture Industry Services Good 10 12 15 Not very good 13 14 18 bad 7 20…
Q: In a study to determine if diabetes malitus is associated with blood group, a randomly selected…
A: In this context, the aim is to test whether there any significant association between blood group…
Q: 10.24 The question of whether the sexual orientation of the mother has an impact on the sexual…
A: a) The populations of interest in this study are sexual orientation of the mothers and the sexual…
Q: The following data includes the year, make, model, mileage (in thousands of miles) and asking price…
A:
Q: The following data includes the year, make, model, mileage (in thousands of miles) and asking price…
A:
Q: A firm wishes to compare three workers performance and the required times by three workers to…
A: Given: Number of persons k= 3 n1=n2=n3=5 The significance level is taken as 0.05.
Q: A Pew Research study conducted in 2017 found that approximately 75% of Americans believe that robots…
A: Given data, Nurse TaxAuditor Fast-FoodWorker 3 4 5 4 5 8 6 4 6…
Q: 9.12 A group of students are classified by their residential origin and full attention to learning:…
A: Solution: 9.12 The given table of data is
Q: The manager of Young Corporation, wants to determine whether or not the type of work schedule for…
A: 1. State the null and alternative Hypotheses: Null Hypothesis: H0: There is no significant…
Q: Find the number of math students at a college taking at least one of the languages: French, German,…
A:
Q: A team of researchers is interested in the effect on physical health of writing about thoughts and…
A: Given.... A team of researchers is interested in the effect on physical health of writing about…
Q: 1) Does taking an aspirin a day help reduce migraine frequency? In a study of 180 volunteers of…
A: (a) An experiment is a procedure that is conducted to know about the cause and effect relationship…
Q: The general social survey asked a sample of 3151 adults how many children they had, and also how…
A: Null hypothesis: H0: Number of children and number of siblings are independent. Alternate…
Q: A researcher would like to kno w whether there is a consistent, predictable relationship between…
A: Given: A researcher would like to know whether there is a consistent, predictable relationship…
Q: The following data includes the year, make, model, mileage (in thousands of miles) and asking price…
A: Correlation is a statistic that measures the degree to which two securities move in relation to each…
Q: A sales manager collected the following data on annual sales for new customer accounts and the…
A: Given : A sales manager collected the following data on annual sales for new customer accounts and…
Q: Listed below are the measured radiation absorption rates ( in 5 - number summary . W/kg)…
A:
Q: The following data includes the year, make, model, mileage (in thousands of miles) and asking price…
A: Correlation is a statistical technique used for analyzing the behavior of two or more variates. Its…
Q: A first year student from the University of Nairobi claims that he was admitted to the University of…
A: The main objective of an ANOVA (one-way) is to compare the means of more than two means to identify…
Q: A set of data has a mean of 16, a media of 15, and a mode of Which of these numbers must be a value…
A: Given : A set of data has Mean = 16 Median = 15
Q: A market investigator returns the following data of 10000 people consulted : 8110 liked chocolates,…
A:
Q: The following data includes the year, make, model, mileage (in thousands of miles) and asking price…
A: Given: Let n be the number of used Honda minivans (n=13). Let X be a random variable that denotes…
Q: Students who are home-schooled often attend their local schools to participate in various types of…
A: Now frame the hypothesis are, Null hypothesis H0: 82% schoolers receive their education at home ,…
Q: A sample of 200 college undergraduates was collected and the student’s gender and method of getting…
A: Proportion is a fraction of population or sample which is having a specific characteristic of…
Q: Consider the following data for 120 scholars of Fountain International School in San Juan City. How…
A:
Q: The following data includes the year, make, model, mileage (in thousands of miles) and asking price…
A: Solution
Q: The following data includes the year, make, model, mileage (in thousands of miles) and asking price…
A: Correlation relation is a relation between two or more variables. Correlation analysis is a tool…
Q: In a survey of 825 human resource professionals concerning challenges they faced in the workplace,…
A: Given that Total number of HR people surveyed (n) = 825 People said employee retention/turnover is…
Q: A population of female mosquitoes has been divided into three age groups: 0-9 day olds 10-19 day…
A:
Q: 3. In an opinion poll, 100 Scottish voters are asked whether they intend voting SNP or Conservative…
A:
Trending now
This is a popular solution!
Step by step
Solved in 3 steps with 3 images
- Periodically, Merrill Lynch customers are asked to evaluate Merrill Lynch financial consultants and services (2000 Merrill Lynch Client Satisfaction Survey). Higher ratings on the client satisfaction survey indicate better service with 7 the maximum service rating. Independent samples of service ratings for two financial consultants are summarized here. Consultant A has 10 years of experience, whereas consultant B has 1 year of experience. Use = .05 and test to see whether the consultant with more experience has the higher population mean service rating. Consultant A Consultant B = 16 = 10 = 6.82 = 6.25 = 0.58 = 0.7 State the null and alternative hypotheses.H0: 1 - 2 Selectgreater than 0greater than or equal to 0less than 0less than or equal to 0equal to 0not equal to 0Item 1Ha: 1 - 2 Selectgreater than 0greater than or equal to 0less than 0less than or equal to 0equal to 0not equal to 0Item 2 Compute the value of the test statistic (to 2 decimals).…Periodically, Merrill Lynch customers are asked to evaluate Merrill Lynch financial consultants and services. Higher ratings on the client satisfaction survey indicate better service, with 7 being the maximum service rating. Independent samples of service ratings for two financial consultants are summarized here. Consultant A has 10 years of experience, whereas consultant B has 1 year of experience. Use α=0.05 and test to see whether the consultant with more experience has the higher population mean service rating. Let customers of Consultant A be population 1. Consultant A Consultant B xbar 6.82 6.25 s 0.64 0.75 n 16 10 Compute the value of the test statistic.A student researcher was surprised to learn that the 2017 NCAA Student-Athlete Substance Use Survey supported that college athletes make healthier decisions in many areas than their peers in the general student body. He collected data of his own, focusing exclusively on male student-athletes to see if such habits vary based on one’s sport. He asked 93 male student-athletes whether they had engaged in binge-drinking in the last month (> 5 drinks in a single sitting). Data are provided in the table below. Lacrosse Hockey Swimming Row Totals Yes – Binge 20 17 15 52 No – did not binge 16 15 10 41 Column totals 36 32 25 93 1. Calculate the effect size. Show the formula and your calculations in the space provided below: 2. Using the degrees of freedom provided by your SPSS output and an alpha value of .05, find the critical value in the appropriate table in the Appendix of your Jackson e-book. Do not round – present all…
- A lecturer at college wanted to know if he can predict student’s quiz results by asking them tocomplete a simple survey. The result of the survey is given below: Quiz Results EQR Study Hrs Age Sex BBT MB MC AuHS LM 15 10 3 19 0 0 1 1 0 1 14 15 4 24 0 0 1 0 0 1 9 15 1 20 0 10 1 0 0 1 6 10 3 21 0 0 1 1 0 1 14 15 4 21 0 9 1 0 0 1 12 10 6 21 0 2 0 1 0 1 12 13 2 21 1 8 1 0 0 0 15 15 0 20 0 8 1 0 0 1 12 15 3 20 0 10 1 0 0 1 13 15 0.2 19 0 8 1 0 0 1 15 15 2 20 0 6 1 0 1 1 12 14 5 20 0 5 1 1 1 1 14 15 7 22 0 8 0 0 0 0 7 7 10 21 1 7 0 0 1 0 11 15 5 24 0 0 1 0 0 1 10 10 3 22 1 0 1 0 0 1 13 11 3 23 1 1 1 1 1 1 13 15 2 22 1 8 0 0 0 0 13 12 4 20 1 7 1 0 1 0 13 10 3 20 1 0 1 0 0 1 8 13 5 20 1 8 0 0 0 0 12 13 5 22 0 5 0 0 0 1 13 15 8 22 0 5 0 1 0 1 10 13 4 23 1 7 1 0 0 1 13 13 0.5 20 1 0 0 0 0 0 12 13 0.5 20 1 0 1 0 0 0 15 15 2 21 0 10 1 0 0 1 10 13 6 22 0 6 1 1 0 1 11 8 5 20 0 10 0 0 1 0 12 10 4 19 1 0 1 0 0 1 8 5 2 20 1 0 1 0 1 0 11…A lecturer at college wanted to know if he can predict student’s quiz results by asking them tocomplete a simple survey. The result of the survey is given below: Quiz Results EQR Study Hrs Age Sex BBT MB MC AuHS LM 15 10 3 19 0 0 1 1 0 1 14 15 4 24 0 0 1 0 0 1 9 15 1 20 0 10 1 0 0 1 6 10 3 21 0 0 1 1 0 1 14 15 4 21 0 9 1 0 0 1 12 10 6 21 0 2 0 1 0 1 12 13 2 21 1 8 1 0 0 0 15 15 0 20 0 8 1 0 0 1 12 15 3 20 0 10 1 0 0 1 13 15 0.2 19 0 8 1 0 0 1 15 15 2 20 0 6 1 0 1 1 12 14 5 20 0 5 1 1 1 1 14 15 7 22 0 8 0 0 0 0 7 7 10 21 1 7 0 0 1 0 11 15 5 24 0 0 1 0 0 1 10 10 3 22 1 0 1 0 0 1 13 11 3 23 1 1 1 1 1 1 13 15 2 22 1 8 0 0 0 0 13 12 4 20 1 7 1 0 1 0 13 10 3 20 1 0 1 0 0 1 8 13 5 20 1 8 0 0 0 0 12 13 5 22 0 5 0 0 0 1 13 15 8 22 0 5 0 1 0 1 10 13 4 23 1 7 1 0 0 1 13 13 0.5 20 1 0 0 0 0 0 12 13 0.5 20 1 0 1 0 0 0 15 15 2 21 0 10 1 0 0 1 10 13 6 22 0 6 1 1 0 1 11 8 5 20 0 10 0 0 1 0 12 10 4 19 1 0 1 0 0 1 8 5 2 20 1 0 1 0 1 0 11…A lecturer at college wanted to know if he can predict student’s quiz results by asking them tocomplete a simple survey. The result of the survey is given below: Quiz Results EQR Study Hrs Age Sex BBT MB MC AuHS LM 15 10 3 19 0 0 1 1 0 1 14 15 4 24 0 0 1 0 0 1 9 15 1 20 0 10 1 0 0 1 6 10 3 21 0 0 1 1 0 1 14 15 4 21 0 9 1 0 0 1 12 10 6 21 0 2 0 1 0 1 12 13 2 21 1 8 1 0 0 0 15 15 0 20 0 8 1 0 0 1 12 15 3 20 0 10 1 0 0 1 13 15 0.2 19 0 8 1 0 0 1 15 15 2 20 0 6 1 0 1 1 12 14 5 20 0 5 1 1 1 1 14 15 7 22 0 8 0 0 0 0 7 7 10 21 1 7 0 0 1 0 11 15 5 24 0 0 1 0 0 1 10 10 3 22 1 0 1 0 0 1 13 11 3 23 1 1 1 1 1 1 13 15 2 22 1 8 0 0 0 0 13 12 4 20 1 7 1 0 1 0 13 10 3 20 1 0 1 0 0 1 8 13 5 20 1 8 0 0 0 0 12 13 5 22 0 5 0 0 0 1 13 15 8 22 0 5 0 1 0 1 10 13 4 23 1 7 1 0 0 1 13 13 0.5 20 1 0 0 0 0 0 12 13 0.5 20 1 0 1 0 0 0 15 15 2 21 0 10 1 0 0 1 10 13 6 22 0 6 1 1 0 1 11 8 5 20 0 10 0 0 1 0 12 10 4 19 1 0 1 0 0 1 8 5 2 20 1 0 1 0 1 0 11…
- A lecturer at college wanted to know if he can predict student’s quiz results by asking them tocomplete a simple survey. The result of the survey is given below: Quiz Results EQR Study Hrs Age Sex BBT MB MC AuHS LM 15 10 3 19 0 0 1 1 0 1 14 15 4 24 0 0 1 0 0 1 9 15 1 20 0 10 1 0 0 1 6 10 3 21 0 0 1 1 0 1 14 15 4 21 0 9 1 0 0 1 12 10 6 21 0 2 0 1 0 1 12 13 2 21 1 8 1 0 0 0 15 15 0 20 0 8 1 0 0 1 12 15 3 20 0 10 1 0 0 1 13 15 0.2 19 0 8 1 0 0 1 15 15 2 20 0 6 1 0 1 1 12 14 5 20 0 5 1 1 1 1 14 15 7 22 0 8 0 0 0 0 7 7 10 21 1 7 0 0 1 0 11 15 5 24 0 0 1 0 0 1 10 10 3 22 1 0 1 0 0 1 13 11 3 23 1 1 1 1 1 1 13 15 2 22 1 8 0 0 0 0 13 12 4 20 1 7 1 0 1 0 13 10 3 20 1 0 1 0 0 1 8 13 5 20 1 8 0 0 0 0 12 13 5 22 0 5 0 0 0 1 13 15 8 22 0 5 0 1 0 1 10 13 4 23 1 7 1 0 0 1 13 13 0.5 20 1 0 0 0 0 0 12 13 0.5 20 1 0 1 0 0 0 15 15 2 21 0 10 1 0 0 1 10 13 6 22 0 6 1 1 0 1 11 8 5 20 0 10 0 0 1 0 12 10 4 19 1 0 1 0 0 1 8 5 2 20 1 0 1 0 1 0 11…a recent issue of the aaRP Bulletin reported that the average weekly pay for a womanwith a high school school degree is $520 (aaRP Bulletin, January–february, 2010). Suppose you would like to determine if the average weekly pay for all working women issignificantly greater than that for women with a high school degree. data providing theweekly pay for a sample of 50 working women are available in the file named weeklyPay.these data are consistent with the findings reported in the aarP article.a. State the hypotheses that should be used to test whether the mean weekly pay forall women is significantly greater than the mean weekly pay for women with a highschool degree.b. use the data in the file named weeklyPay to compute the sample mean, the test statistic, and the p-value.c. use a = .05. what is your conclusion?d. repeat the hypothesis test using the critical value approach.a recent issue of the aaRP Bulletin reported that the average weekly pay for a womanwith a high school school degree is $520 (aaRP Bulletin, January–february, 2010). Suppose you would like to determine if the average weekly pay for all working women issignificantly greater than that for women with a high school degree. data providing theweekly pay for a sample of 50 working women are available in the file named weeklyPay.these data are consistent with the findings reported in the aarP article.a. State the hypotheses that should be used to test whether the mean weekly pay forall women is significantly greater than the mean weekly pay for women with a highschool degree.b. use the data in the file named weeklyPay to compute the sample mean, the test statistic, and the p-value
- a recent issue of the aaRP Bulletin reported that the average weekly pay for a womanwith a high school school degree is $520 (aaRP Bulletin, January–february, 2010). Suppose you would like to determine if the average weekly pay for all working women issignificantly greater than that for women with a high school degree. data providing theweekly pay for a sample of 50 working women are available in the file named weeklyPay.these data are consistent with the findings reported in the aarP article.a. State the hypotheses that should be used to test whether the mean weekly pay forall women is significantly greater than the mean weekly pay for women with a highschool degreeLarge companies typically collect volumes of data before designing a product, not only to gain information as to whether the product should be released, but also to pinpoint which markets would be the best targets for the product. Several months ago, I was interviewed by such a company while shopping at a mall. I was asked about my exercise habits and whether or not I'd be interested in buying a video/DVD designed to teach stretching exercises. I fall into the male, 18 – 35-years-old category, and I guessed that, like me, many males in that category would not be interested in a stretching video. My friend Diane falls in the female, older-than-35 category, and I was thinking that she might like the stretching video. After being interviewed, I looked at the interviewer's results. Of the 93 people in my market category who had been interviewed, 17 said they would buy the product, and of the 113 people in Diane's market category, 34 said they would buy it. Assuming that these data came…Large companies typically collect volumes of data before designing a product, not only to gain information as to whether the product should be released, but also to pinpoint which markets would be the best targets for the product. Several months ago, I was interviewed by such a company while shopping at a mall. I was asked about my exercise habits and whether or not I'd be interested in buying a video/DVD designed to teach stretching exercises. I fall into the male, 18 – 35-years-old category, and I guessed that, like me, many males in that category would not be interested in a stretching video. My friend Amanda falls in the female, older-than-35 category, and I was thinking that she might like the stretching video. After being interviewed, I looked at the interviewer's results. Of the 97 people in my market category who had been interviewed, 16 said they would buy the product, and of the 101 people in Amanda's market category, 31 said they would buy it. Assuming that these data came…