A sample of size 9 was collected from an unknown population 12 12 13 14 15 15 16 16 21 1. Use the table of expected z-scores (rounded to the nearest tenth) below to construct the normality plot with expected z-scores on the x-axis and the observations on the y-axis: 5 6 -1.2 -1.3 -0.5 -0.6 -0.2 0.2 0.6 1.3 0 0.5 1.2 22 21 20 19 18 17 Clear All Draw: 16 15 14 13 1 7 -1.4 -0.8 -0.4 0 0.4 0.8 1.4 8 -1.4 -0.9 -0.5 -0.2 0.2 0.5 0.9 1.4 9 -1.5 -0.9 -0.6 -0.3 0 0.3 0.6 0.9 1.5 do the graph follow the lines make sure it is exact
A sample of size 9 was collected from an unknown population 12 12 13 14 15 15 16 16 21 1. Use the table of expected z-scores (rounded to the nearest tenth) below to construct the normality plot with expected z-scores on the x-axis and the observations on the y-axis: 5 6 -1.2 -1.3 -0.5 -0.6 -0.2 0.2 0.6 1.3 0 0.5 1.2 22 21 20 19 18 17 Clear All Draw: 16 15 14 13 1 7 -1.4 -0.8 -0.4 0 0.4 0.8 1.4 8 -1.4 -0.9 -0.5 -0.2 0.2 0.5 0.9 1.4 9 -1.5 -0.9 -0.6 -0.3 0 0.3 0.6 0.9 1.5 do the graph follow the lines make sure it is exact

MATLAB: An Introduction with Applications
6th Edition
ISBN:9781119256830
Author:Amos Gilat
Publisher:Amos Gilat
Chapter1: Starting With Matlab
Section: Chapter Questions
Problem 1P

Related questions
Question
100%
Transcribed Image Text:Question 5
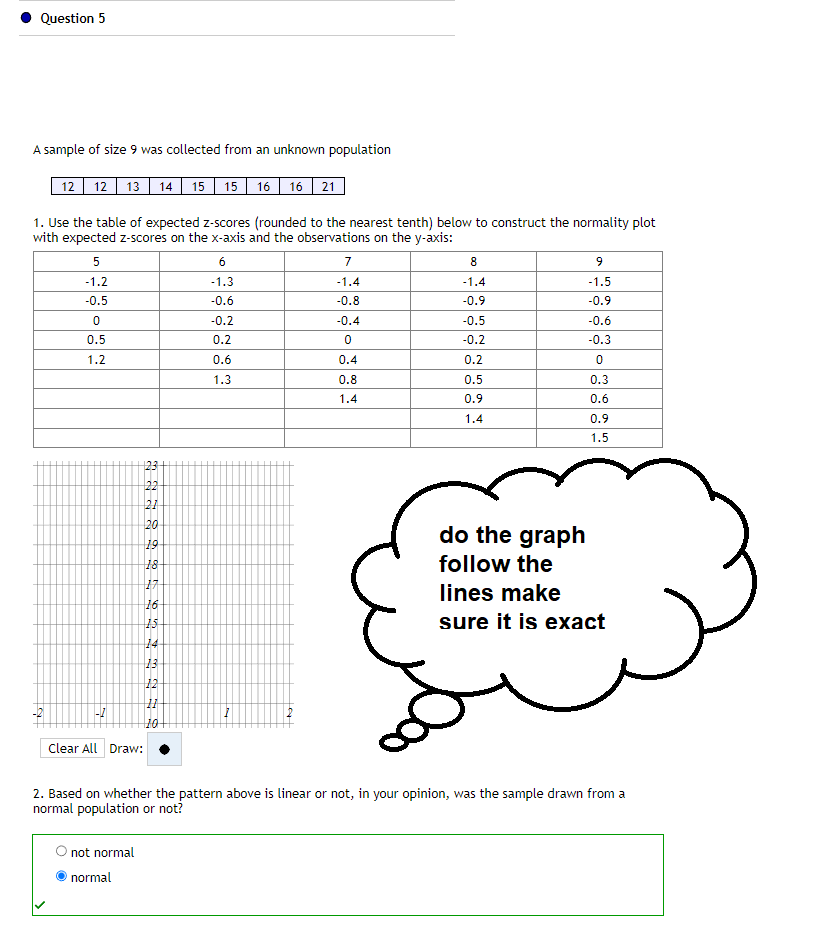
A sample of size 9 was collected from an unknown population
12 | 12 | 13 | 14 | 15 | 15 | 16 | 16 | 21
1. Use the table of expected z-scores (rounded to the nearest tenth) below to construct the normality plot
with expected z-scores on the x-axis and the observations on the y-axis:
5
-1.2
-0.5
0
0.5
1.2
22
21
20
19
18
17
16
15
14
13
12
11
Clear All Draw:
not normal
normal
6
-1.3
-0.6
-0.2
0.2
0.6
1.3
7
-1.4
-0.8
-0.4
0
0.4
0.8
1.4
8
-1.4
-0.9
-0.5
-0.2
0.2
0.5
0.9
1.4
9
-1.5
-0.9
-0.6
-0.3
0
0.3
0.6
0.9
1.5
do the graph
follow the
lines make
sure it is exact
2. Based on whether the pattern above is linear or not, in your opinion, was the sample drawn from a
normal population or not?
Expert Solution
This question has been solved!
Explore an expertly crafted, step-by-step solution for a thorough understanding of key concepts.

Step by step
Solved in 2 steps with 1 images

Recommended textbooks for you
MATLAB: An Introduction with Applications
Statistics
ISBN:
9781119256830
Author:
Amos Gilat
Publisher:
John Wiley & Sons Inc

Probability and Statistics for Engineering and th…
Statistics
ISBN:
9781305251809
Author:
Jay L. Devore
Publisher:
Cengage Learning

Statistics for The Behavioral Sciences (MindTap C…
Statistics
ISBN:
9781305504912
Author:
Frederick J Gravetter, Larry B. Wallnau
Publisher:
Cengage Learning
MATLAB: An Introduction with Applications
Statistics
ISBN:
9781119256830
Author:
Amos Gilat
Publisher:
John Wiley & Sons Inc
Probability and Statistics for Engineering and th…
Statistics
ISBN:
9781305251809
Author:
Jay L. Devore
Publisher:
Cengage Learning
Statistics for The Behavioral Sciences (MindTap C…
Statistics
ISBN:
9781305504912
Author:
Frederick J Gravetter, Larry B. Wallnau
Publisher:
Cengage Learning

Elementary Statistics: Picturing the World (7th E…
Statistics
ISBN:
9780134683416
Author:
Ron Larson, Betsy Farber
Publisher:
PEARSON

The Basic Practice of Statistics
Statistics
ISBN:
9781319042578
Author:
David S. Moore, William I. Notz, Michael A. Fligner
Publisher:
W. H. Freeman

Introduction to the Practice of Statistics
Statistics
ISBN:
9781319013387
Author:
David S. Moore, George P. McCabe, Bruce A. Craig
Publisher:
W. H. Freeman