A sample of small cars was selected, and the values of x = horsepower and y estimated regression equation ŷ = 53.0 - 0.180x. (a) How would you interpret b = -0.180? = fuel efficiency (mpg) were determined for each car. Fitting the simple linear regression model gave the For each one-unit increase in horsepower the predicted fuel efficiency decreases by 0.180 mpg. For each one-unit increase in mpg the predicted horsepower increases by 0.180 horsepower. For each one-unit decrease in mpg the predicted horsepower decreases by 0.180 horsepower. For each one-unit increase in horsepower the predicted fuel efficiency increases by 0.180 mpg. For each one-unit increase in mpg the predicted horsepower decreases by 0.180 horsepower. (b) Substituting x = 100 gives ŷ = 35. Give two different interpretations of this number. (Select all that apply.) An estimate of the horsepower when the fuel efficiency is 100. A prediction for the fuel efficiency of a car whose horsepower is 35. A prediction for the fuel efficiency of a car whose horsepower is 100. An estimate of the mean fuel efficiency when the horsepower is 35. An estimate of the mean fuel efficiency when the horsepower is 100. (c) What is the predicted efficiency for a car with a 300-horsepower engine? = Why do you think this has occurred? This result is valid, and has probably occurred because 300 is outside the range of the horsepower ratings for the small cars used in the sample. This result cannot be valid, and has probably occurred because 300 is outside the range of the horsepower ratings for the small cars used in the sample. This result is valid, and has probably occurred because 300 is outside the range of the horsepower ratings for a car. This result cannot be valid, and has probably occurred because 300 is outside the range of the horsepower ratings for a car. (d) Interpret r² = 0.690 in the context of this problem. This tells us that 69.0% of the variation in horsepower is attributable to the approximate linear relationship between horsepower and fuel efficiency. This tells us that 31.0% of the variation in fuel efficiency is attributable to the approximate linear relationship between horsepower and fuel efficiency. This tells us that 69.0% of the variation in fuel efficiency is attributable to the approximate linear relationship between horsepower and fuel efficiency. This tells us that 31.0% of the variation in horsepower is attributable to the approximate linear relationship between horsepower and fuel efficiency. (e) Interpret s = 2.0 in the context of this problem. e This tells us that 2 mpg is a typical average of the fuel efficiency of a car in the sample from the value predicted by the least-squares line. This tells us that 2 horsepower is a typical deviation of the horsepower of a car in the sample from the value predicted by the least-squares line. This tells us that 2 mpg is a typical deviation of the fuel efficiency of a car in the sample from the value predicted by the least-squares line. This tells us that 2 mpg is a typical deviation of the horsepower of a car in the sample from the value predicted by the least-squares line. This tells us that 2 horsepower is a typical average of the horsepower of a car in the sample from the value predicted by the least-squares line.
A sample of small cars was selected, and the values of x = horsepower and y estimated regression equation ŷ = 53.0 - 0.180x. (a) How would you interpret b = -0.180? = fuel efficiency (mpg) were determined for each car. Fitting the simple linear regression model gave the For each one-unit increase in horsepower the predicted fuel efficiency decreases by 0.180 mpg. For each one-unit increase in mpg the predicted horsepower increases by 0.180 horsepower. For each one-unit decrease in mpg the predicted horsepower decreases by 0.180 horsepower. For each one-unit increase in horsepower the predicted fuel efficiency increases by 0.180 mpg. For each one-unit increase in mpg the predicted horsepower decreases by 0.180 horsepower. (b) Substituting x = 100 gives ŷ = 35. Give two different interpretations of this number. (Select all that apply.) An estimate of the horsepower when the fuel efficiency is 100. A prediction for the fuel efficiency of a car whose horsepower is 35. A prediction for the fuel efficiency of a car whose horsepower is 100. An estimate of the mean fuel efficiency when the horsepower is 35. An estimate of the mean fuel efficiency when the horsepower is 100. (c) What is the predicted efficiency for a car with a 300-horsepower engine? = Why do you think this has occurred? This result is valid, and has probably occurred because 300 is outside the range of the horsepower ratings for the small cars used in the sample. This result cannot be valid, and has probably occurred because 300 is outside the range of the horsepower ratings for the small cars used in the sample. This result is valid, and has probably occurred because 300 is outside the range of the horsepower ratings for a car. This result cannot be valid, and has probably occurred because 300 is outside the range of the horsepower ratings for a car. (d) Interpret r² = 0.690 in the context of this problem. This tells us that 69.0% of the variation in horsepower is attributable to the approximate linear relationship between horsepower and fuel efficiency. This tells us that 31.0% of the variation in fuel efficiency is attributable to the approximate linear relationship between horsepower and fuel efficiency. This tells us that 69.0% of the variation in fuel efficiency is attributable to the approximate linear relationship between horsepower and fuel efficiency. This tells us that 31.0% of the variation in horsepower is attributable to the approximate linear relationship between horsepower and fuel efficiency. (e) Interpret s = 2.0 in the context of this problem. e This tells us that 2 mpg is a typical average of the fuel efficiency of a car in the sample from the value predicted by the least-squares line. This tells us that 2 horsepower is a typical deviation of the horsepower of a car in the sample from the value predicted by the least-squares line. This tells us that 2 mpg is a typical deviation of the fuel efficiency of a car in the sample from the value predicted by the least-squares line. This tells us that 2 mpg is a typical deviation of the horsepower of a car in the sample from the value predicted by the least-squares line. This tells us that 2 horsepower is a typical average of the horsepower of a car in the sample from the value predicted by the least-squares line.

College Algebra
7th Edition
ISBN:9781305115545
Author:James Stewart, Lothar Redlin, Saleem Watson
Publisher:James Stewart, Lothar Redlin, Saleem Watson
Chapter1: Equations And Graphs
Section: Chapter Questions
Problem 10T: Olympic Pole Vault The graph in Figure 7 indicates that in recent years the winning Olympic men’s...

Related questions
Question
13.1.2
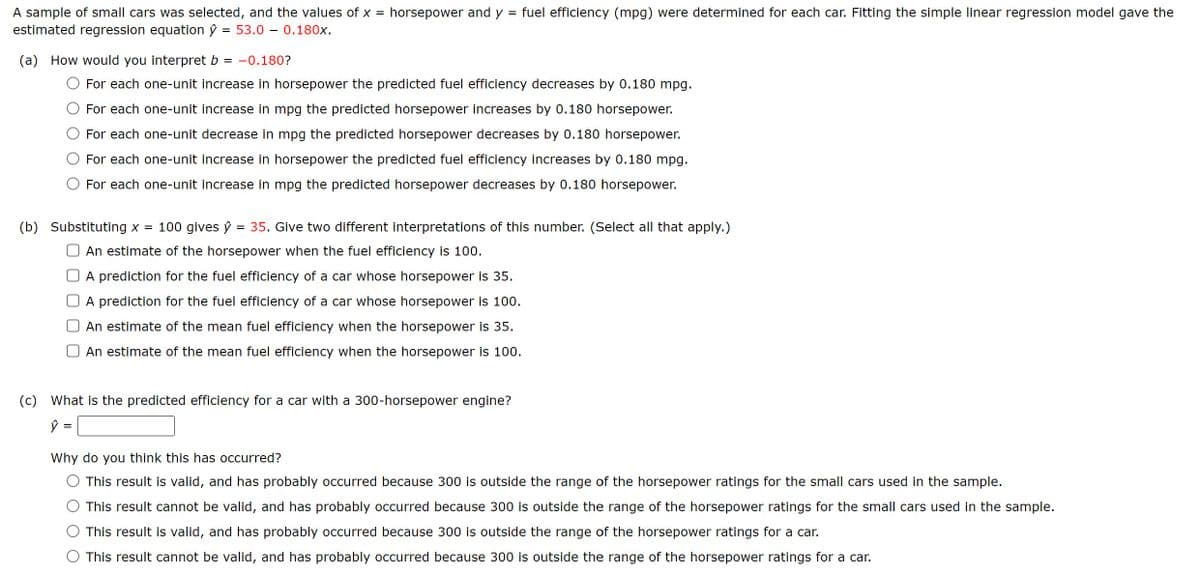
Transcribed Image Text:A sample of small cars was selected, and the values of x = horsepower and y
estimated regression equation ŷ
= 53.0 - 0.180x.
(a) How would you interpret b
= -0.180?
=
fuel efficiency (mpg) were determined for each car. Fitting the simple linear regression model gave the
For each one-unit increase in horsepower the predicted fuel efficiency decreases by 0.180 mpg.
For each one-unit increase in mpg the predicted horsepower increases by 0.180 horsepower.
For each one-unit decrease in mpg the predicted horsepower decreases by 0.180 horsepower.
For each one-unit increase in horsepower the predicted fuel efficiency increases by 0.180 mpg.
For each one-unit increase in mpg the predicted horsepower decreases by 0.180 horsepower.
(b) Substituting x = 100 gives ŷ = 35. Give two different interpretations of this number. (Select all that apply.)
An estimate of the horsepower when the fuel efficiency is 100.
A prediction for the fuel efficiency of a car whose horsepower is 35.
A prediction for the fuel efficiency of a car whose horsepower is 100.
An estimate of the mean fuel efficiency when the horsepower is 35.
An estimate of the mean fuel efficiency when the horsepower is 100.
(c) What is the predicted efficiency for a car with a 300-horsepower engine?
=
Why do you think this has occurred?
This result is valid, and has probably occurred because 300 is outside the range of the horsepower ratings for the small cars used in the sample.
This result cannot be valid, and has probably occurred because 300 is outside the range of the horsepower ratings for the small cars used in the sample.
This result is valid, and has probably occurred because 300 is outside the range of the horsepower ratings for a car.
This result cannot be valid, and has probably occurred because 300 is outside the range of the horsepower ratings for a car.
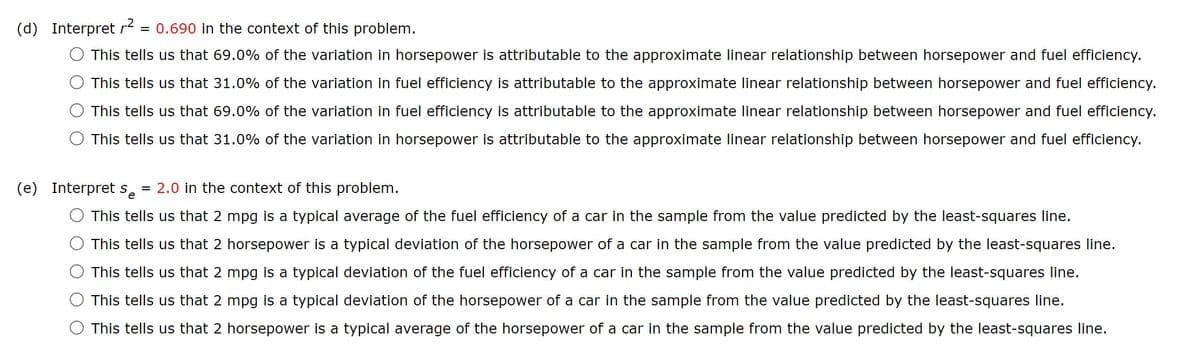
Transcribed Image Text:(d) Interpret r²
= 0.690 in the context of this problem.
This tells us that 69.0% of the variation in horsepower is attributable to the approximate linear relationship between horsepower and fuel efficiency.
This tells us that 31.0% of the variation in fuel efficiency is attributable to the approximate linear relationship between horsepower and fuel efficiency.
This tells us that 69.0% of the variation in fuel efficiency is attributable to the approximate linear relationship between horsepower and fuel efficiency.
This tells us that 31.0% of the variation in horsepower is attributable to the approximate linear relationship between horsepower and fuel efficiency.
(e) Interpret s = 2.0 in the context of this problem.
e
This tells us that 2 mpg is a typical average of the fuel efficiency of a car in the sample from the value predicted by the least-squares line.
This tells us that 2 horsepower is a typical deviation of the horsepower of a car in the sample from the value predicted by the least-squares line.
This tells us that 2 mpg is a typical deviation of the fuel efficiency of a car in the sample from the value predicted by the least-squares line.
This tells us that 2 mpg is a typical deviation of the horsepower of a car in the sample from the value predicted by the least-squares line.
This tells us that 2 horsepower is a typical average of the horsepower of a car in the sample from the value predicted by the least-squares line.
Expert Solution
This question has been solved!
Explore an expertly crafted, step-by-step solution for a thorough understanding of key concepts.

This is a popular solution!

Trending now
This is a popular solution!

Step by step
Solved in 2 steps

Recommended textbooks for you
College Algebra
Algebra
ISBN:
9781305115545
Author:
James Stewart, Lothar Redlin, Saleem Watson
Publisher:
Cengage Learning

Algebra and Trigonometry (MindTap Course List)
Algebra
ISBN:
9781305071742
Author:
James Stewart, Lothar Redlin, Saleem Watson
Publisher:
Cengage Learning

Trigonometry (MindTap Course List)
Trigonometry
ISBN:
9781305652224
Author:
Charles P. McKeague, Mark D. Turner
Publisher:
Cengage Learning
College Algebra
Algebra
ISBN:
9781305115545
Author:
James Stewart, Lothar Redlin, Saleem Watson
Publisher:
Cengage Learning
Algebra and Trigonometry (MindTap Course List)
Algebra
ISBN:
9781305071742
Author:
James Stewart, Lothar Redlin, Saleem Watson
Publisher:
Cengage Learning
Trigonometry (MindTap Course List)
Trigonometry
ISBN:
9781305652224
Author:
Charles P. McKeague, Mark D. Turner
Publisher:
Cengage Learning
