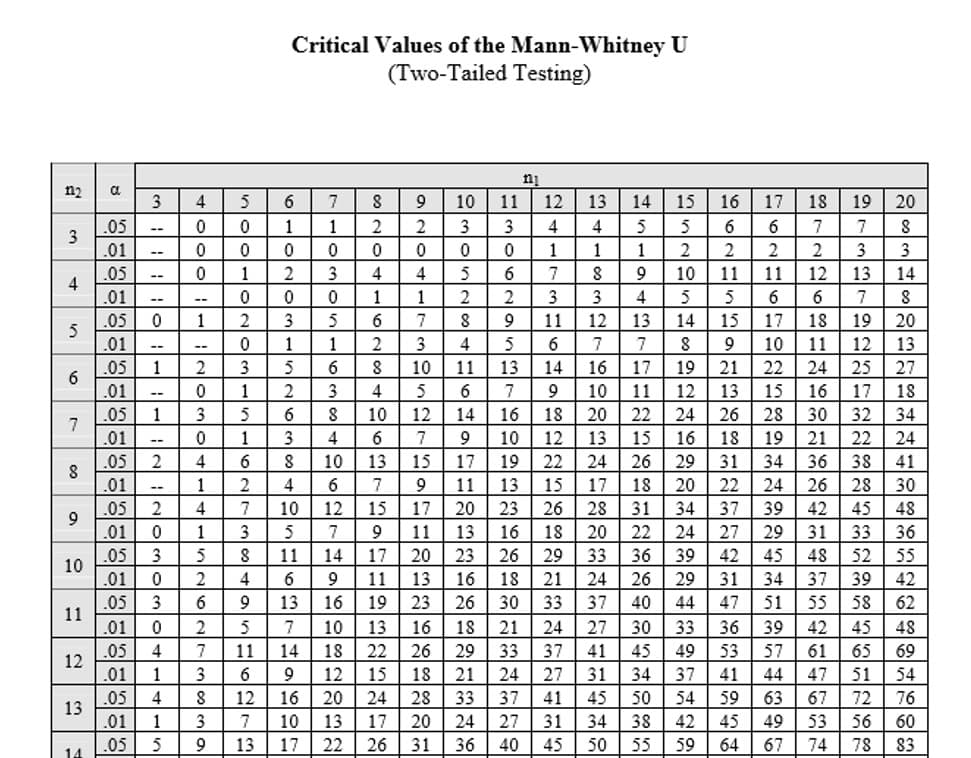
Using the following Mann-Whitney critical value chart, what would you determine the appropriate critical statistic to be for a data set that had two groups, each with 8 participants. You do not have a directional hypothesis, so you will be using a two-tailed test, with an alpha of 0.05.
Using the following Mann-Whitney critical value chart, what would you determine the appropriate critical statistic to be for a data set that had two groups, each with 8 participants. You do not have a directional hypothesis, so you will be using a two-tailed test, with an alpha of 0.05.

Algebra & Trigonometry with Analytic Geometry
13th Edition
ISBN:9781133382119
Author:Swokowski
Publisher:Swokowski
Chapter10: Sequences, Series, And Probability
Section10.8: Probability
Problem 31E

Related questions
Question
Using the following Mann-Whitney critical value chart, what would you determine the appropriate critical statistic to be for a data set that had two groups, each with 8 participants. You do not have a directional hypothesis, so you will be using a two-tailed test, with an alpha of 0.05.
Transcribed Image Text:a
112
3
4
5
6
7
8
9
10
11
12
13
14
a
.05
.01
.05
.01
.05
.01
.05
.01
.05
.01
.05
.01
.05
2
.01
0
.05
3
.01
0
.05 3
28
3
alalali
.05
.01
.05
--
0
1
--
1
2
--
.01 0
.05
.01 1
N
4
1
i
5
ia
4
0
0
0
2
5
4 7 11
3 6
1
2
0
3
0
4
1
4
1
5
2
6
Mw
5
6
0
1
0
0
1 2
0
0
2
3
0
1
3
5
1 2
5
6
3
8
4
10
5
11
6
13
1
6
2
7
3
8
4
9
Critical Values of the Mann-Whitney U
(Two-Tailed Testing)
8 12
3 7
9 13
14
16
10
17
8
2
0
3
4
0
1
5
6
1
2
6
8
3
4
8 10
4
10
6
7
1
0
6
13
7
12
15
7
9
14
17
9
11
16
19
10 13
18 22
15
16
26
12
18
20
28
13
17 20
22 26 31
BEEF
24
T
+5
ni
9
10
11 12 13
15 16
20
2
3
3 4
4
5 6
6
7
8
0
0
0
1
1
2 2
2
3
3
4
5
6
7
8 9
10
11
11
12
13
14
1
2
2
3
3
4
5
5 6 6 7 8
7
8
9
11
12
13
14
15
18 19
3
4
5 6
7
7
8
9
11
12
10
11
13 14
16
17
19
21 22
24 25 27
5
6
7
9
10
11
12
13
15 16 17
18
12
14
16
18 20
22 24 26
28
30 32 34
7
9
10
12 13
15 16
18
26 29 31 34
19 21 22 24
36 38
15
17
19
22 24
41
9
11
13
15
22 24 26
28
30
17 18 20
26 28 31 34
17
20 23
37 39 42
45
48
11
13
16
18
27 29
31
33 36
20 22 24
33 36 39
20 23
26 29
42 45
48
52 55
13
16
18
21
24
26 29
31 34
37 39 42
23 26 30
33
37 40 44
47 51
55 58 62
18 21
24 27
30 33
36
45 48
29 33
37
41
45
49
53
69
21
24
27
31
34
37 41
54
33
37 41 45 50
76
24
27
31
56
60
36
40 45
78 83
25
14
5
1
4354
34 38 42
50
17
45
55 59 64
H
17
10
18 19
7
2
la
39
42
57 61 65
59 63 67
49
53
67
74
44 47 51
انار
مان اے اما
72
20
13
Expert Solution
This question has been solved!
Explore an expertly crafted, step-by-step solution for a thorough understanding of key concepts.

This is a popular solution!

Trending now
This is a popular solution!

Step by step
Solved in 2 steps

Recommended textbooks for you
Algebra & Trigonometry with Analytic Geometry
Algebra
ISBN:
9781133382119
Author:
Swokowski
Publisher:
Cengage
Algebra & Trigonometry with Analytic Geometry
Algebra
ISBN:
9781133382119
Author:
Swokowski
Publisher:
Cengage