A school administrator believes that the mean class GPAS for a given course are higher than the preferred mean of 2.75 at a significance level of 0.05, and checks a randomly chosen sample of 50 classes. Create a histogram, and calculate a, the t-statistic, and the p-value. From the histogram, can normality be assumed? Pick Yes x = Ex: 1.234 No t= p = Since the p-value is Pick than the significance level 0.05, the null hypothesis Pick Pick evidence exists that the mean GPA is greater than 2.75.
A school administrator believes that the mean class GPAS for a given course are higher than the preferred mean of 2.75 at a significance level of 0.05, and checks a randomly chosen sample of 50 classes. Create a histogram, and calculate a, the t-statistic, and the p-value. From the histogram, can normality be assumed? Pick Yes x = Ex: 1.234 No t= p = Since the p-value is Pick than the significance level 0.05, the null hypothesis Pick Pick evidence exists that the mean GPA is greater than 2.75.

MATLAB: An Introduction with Applications
6th Edition
ISBN:9781119256830
Author:Amos Gilat
Publisher:Amos Gilat
Chapter1: Starting With Matlab
Section: Chapter Questions
Problem 1P

Related questions
Topic Video
Question
Hi, Please answer all parts.
- Can normality be assumed?
Last parts, the options are:
- P Value : greater than OR Less than
- Null hypothesis: Fails to be rejected OR Is rejected
-
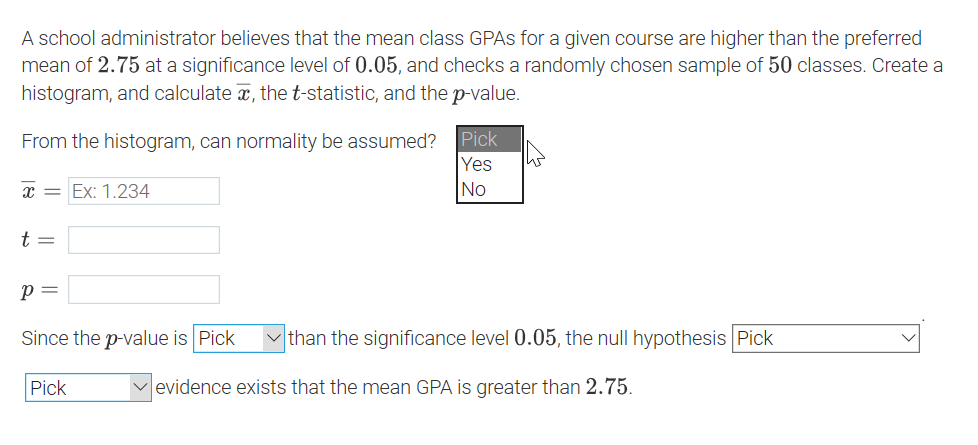
Transcribed Image Text:A school administrator believes that the mean class GPAS for a given course are higher than the preferred
mean of 2.75 at a significance level of 0.05, and checks a randomly chosen sample of 50 classes. Create a
histogram, and calculate x, the t-statistic, and the p-value.
From the histogram, can normality be assumed?
Yes
No
Pick
x = Ex: 1.234
t =
= d
Since the p-value is Pick
than the significance level 0.05, the null hypothesis Pick
Pick
evidence exists that the mean GPA is greater than 2.75.
![A
B
D
E
F
H
J
1
2.85
2.73
Frequency of 'Field1'
3
2.43
8
100%
4
3.01
90%
7
2.84
80%
6
70%
3.13
60%
7
2.81
50%
8
3.02
40%
30%
9.
3.10
20%
10
2.98
10%
11
2.94
0%
12
2.70
13
2.84
14
2.41
15
3.05
Field1
16
2.91
17
2.70
18
2.78
19
3.11
20
2.58
21
3.18
22
2.85
23
3.01
24
2.87
25
2.92
26
2.42
27
2.68
28
2.69
29
2.53
30
2.70
31
2.65
32
2.68
33
2.93
34
2.77
35
2.71
36
2.66
37
2.78
38
2.97
39
2.83
40
2.77
41
3.16
42
2.97
43
2.86
44
2.73
45
2.94
46
2.65
47
2.94
48
2.71
49
2.85
50
3.02
51
52
Frequency
(2.83, 2.86]
(2.68, 2.71]
(2.92, 2.95]
(3.01, 3.04]
[2.41, 2.44]
(2.65, 2.68]
(2.71, 2.74]
(2.77, 2.80]
(2.95, 2.98]
(3.16, 3.19]
(2.53, 2.56]
(2.56, 2.59]
* (2.62, 2.65] I
(2.74, 2.77]
(2.80, 2.83]
(2.86, 2.89]
(2.89, 2.92]
(3.04, 3.07]
(3.07, 3.10]
(3.10, 3.13]
(3.13, 3.16]
(2.44, 2.47]
(2.47, 2.50]
(2.50, 2.53]
(2.59, 2.62]
(2.98, 3.01]](/v2/_next/image?url=https%3A%2F%2Fcontent.bartleby.com%2Fqna-images%2Fquestion%2F52bd3cfe-3c9b-40ce-8732-3b0b81ba9280%2F4b46bac4-236d-4520-9450-0095a50d26c7%2Fpn8ir9n_processed.png&w=3840&q=75)
Transcribed Image Text:A
B
D
E
F
H
J
1
2.85
2.73
Frequency of 'Field1'
3
2.43
8
100%
4
3.01
90%
7
2.84
80%
6
70%
3.13
60%
7
2.81
50%
8
3.02
40%
30%
9.
3.10
20%
10
2.98
10%
11
2.94
0%
12
2.70
13
2.84
14
2.41
15
3.05
Field1
16
2.91
17
2.70
18
2.78
19
3.11
20
2.58
21
3.18
22
2.85
23
3.01
24
2.87
25
2.92
26
2.42
27
2.68
28
2.69
29
2.53
30
2.70
31
2.65
32
2.68
33
2.93
34
2.77
35
2.71
36
2.66
37
2.78
38
2.97
39
2.83
40
2.77
41
3.16
42
2.97
43
2.86
44
2.73
45
2.94
46
2.65
47
2.94
48
2.71
49
2.85
50
3.02
51
52
Frequency
(2.83, 2.86]
(2.68, 2.71]
(2.92, 2.95]
(3.01, 3.04]
[2.41, 2.44]
(2.65, 2.68]
(2.71, 2.74]
(2.77, 2.80]
(2.95, 2.98]
(3.16, 3.19]
(2.53, 2.56]
(2.56, 2.59]
* (2.62, 2.65] I
(2.74, 2.77]
(2.80, 2.83]
(2.86, 2.89]
(2.89, 2.92]
(3.04, 3.07]
(3.07, 3.10]
(3.10, 3.13]
(3.13, 3.16]
(2.44, 2.47]
(2.47, 2.50]
(2.50, 2.53]
(2.59, 2.62]
(2.98, 3.01]
Expert Solution
This question has been solved!
Explore an expertly crafted, step-by-step solution for a thorough understanding of key concepts.

This is a popular solution!

Trending now
This is a popular solution!

Step by step
Solved in 4 steps with 5 images

Knowledge Booster


Learn more about
Need a deep-dive on the concept behind this application? Look no further. Learn more about this topic, statistics and related others by exploring similar questions and additional content below.Recommended textbooks for you
MATLAB: An Introduction with Applications
Statistics
ISBN:
9781119256830
Author:
Amos Gilat
Publisher:
John Wiley & Sons Inc

Probability and Statistics for Engineering and th…
Statistics
ISBN:
9781305251809
Author:
Jay L. Devore
Publisher:
Cengage Learning

Statistics for The Behavioral Sciences (MindTap C…
Statistics
ISBN:
9781305504912
Author:
Frederick J Gravetter, Larry B. Wallnau
Publisher:
Cengage Learning
MATLAB: An Introduction with Applications
Statistics
ISBN:
9781119256830
Author:
Amos Gilat
Publisher:
John Wiley & Sons Inc
Probability and Statistics for Engineering and th…
Statistics
ISBN:
9781305251809
Author:
Jay L. Devore
Publisher:
Cengage Learning
Statistics for The Behavioral Sciences (MindTap C…
Statistics
ISBN:
9781305504912
Author:
Frederick J Gravetter, Larry B. Wallnau
Publisher:
Cengage Learning

Elementary Statistics: Picturing the World (7th E…
Statistics
ISBN:
9780134683416
Author:
Ron Larson, Betsy Farber
Publisher:
PEARSON

The Basic Practice of Statistics
Statistics
ISBN:
9781319042578
Author:
David S. Moore, William I. Notz, Michael A. Fligner
Publisher:
W. H. Freeman

Introduction to the Practice of Statistics
Statistics
ISBN:
9781319013387
Author:
David S. Moore, George P. McCabe, Bruce A. Craig
Publisher:
W. H. Freeman