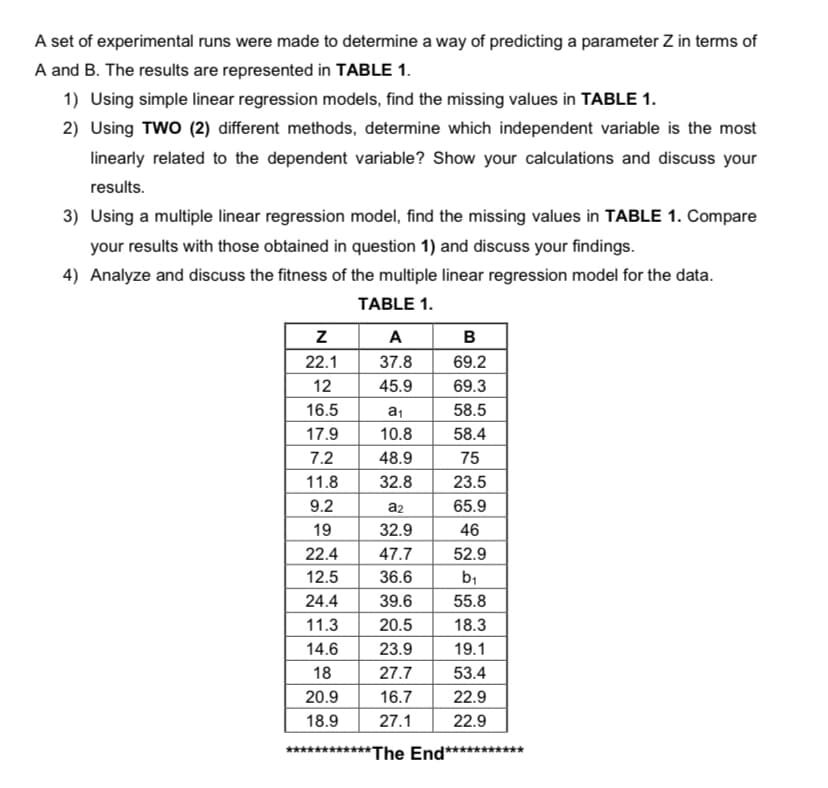
A set of experimental runs were made to determine a way of predicting a parameter Z in terms of A and B. The results are represented in TABLE 1. 1) Using simple linear regression models, find the missing values in TABLE 1. 2) Using TWO (2) different methods, determine which independent variable is the most linearly related to the dependent variable? Show your calculations and discuss your results. 3) Using a multiple linear regression model, find the missing values in TABLE 1. Compare your results with those obtained in question 1) and discuss your findings. 4) Analyze and discuss the fitness of the multiple linear regression model for the data. TABLE 1. Z 22.1 12 16.5 17.9 7.2 11.8 9.2 19 22.4 12.5 24.4 11.3 14.6 18 A 37.8 45.9 a₁ 10.8 48.9 32.8 a2 32.9 47.7 36.6 39.6 20.5 23.9 27.7 16.7 27.1 B 69.2 69.3 58.5 58.4 75 23.5 65.9 46 52.9 b₁ 55.8 18.3 19.1 53.4 22.9 22.9 20.9 18.9 ************The End**
A set of experimental runs were made to determine a way of predicting a parameter Z in terms of A and B. The results are represented in TABLE 1. 1) Using simple linear regression models, find the missing values in TABLE 1. 2) Using TWO (2) different methods, determine which independent variable is the most linearly related to the dependent variable? Show your calculations and discuss your results. 3) Using a multiple linear regression model, find the missing values in TABLE 1. Compare your results with those obtained in question 1) and discuss your findings. 4) Analyze and discuss the fitness of the multiple linear regression model for the data. TABLE 1. Z 22.1 12 16.5 17.9 7.2 11.8 9.2 19 22.4 12.5 24.4 11.3 14.6 18 A 37.8 45.9 a₁ 10.8 48.9 32.8 a2 32.9 47.7 36.6 39.6 20.5 23.9 27.7 16.7 27.1 B 69.2 69.3 58.5 58.4 75 23.5 65.9 46 52.9 b₁ 55.8 18.3 19.1 53.4 22.9 22.9 20.9 18.9 ************The End**
College Algebra
7th Edition
ISBN:9781305115545
Author:James Stewart, Lothar Redlin, Saleem Watson
Publisher:James Stewart, Lothar Redlin, Saleem Watson
Chapter1: Equations And Graphs
Section: Chapter Questions
Problem 10T: Olympic Pole Vault The graph in Figure 7 indicates that in recent years the winning Olympic men’s...
Related questions
Question

Transcribed Image Text:A set of experimental runs were made to determine a way of predicting a parameter Z in terms of
A and B. The results are represented in TABLE 1.
1) Using simple linear regression models, find the missing values in TABLE 1.
2) Using TWO (2) different methods, determine which independent variable is the most
linearly related to the dependent variable? Show your calculations and discuss your
results.
3) Using a multiple linear regression model, find the missing values in TABLE 1. Compare
your results with those obtained in question 1) and discuss your findings.
4) Analyze and discuss the fitness of the multiple linear regression model for the data.
TABLE 1.
Z
22.1
12
16.5
17.9
7.2
11.8
9.2
19
22.4
12.5
24.4
11.3
14.6
18
20.9
18.9
A
37.8
45.9
a₁
10.8
48.9
32.8
B
69.2
69.3
58.5
58.4
75
23.5
65.9
46
52.9
b₁
55.8
18.3
19.1
53.4
22.9
22.9
a2
32.9
47.7
36.6
39.6
20.5
23.9
27.7
16.7
27.1
**The End*
Expert Solution
This question has been solved!
Explore an expertly crafted, step-by-step solution for a thorough understanding of key concepts.
Step by step
Solved in 7 steps with 11 images

Recommended textbooks for you

College Algebra
Algebra
ISBN:
9781305115545
Author:
James Stewart, Lothar Redlin, Saleem Watson
Publisher:
Cengage Learning

Elementary Linear Algebra (MindTap Course List)
Algebra
ISBN:
9781305658004
Author:
Ron Larson
Publisher:
Cengage Learning

College Algebra
Algebra
ISBN:
9781305115545
Author:
James Stewart, Lothar Redlin, Saleem Watson
Publisher:
Cengage Learning

Elementary Linear Algebra (MindTap Course List)
Algebra
ISBN:
9781305658004
Author:
Ron Larson
Publisher:
Cengage Learning