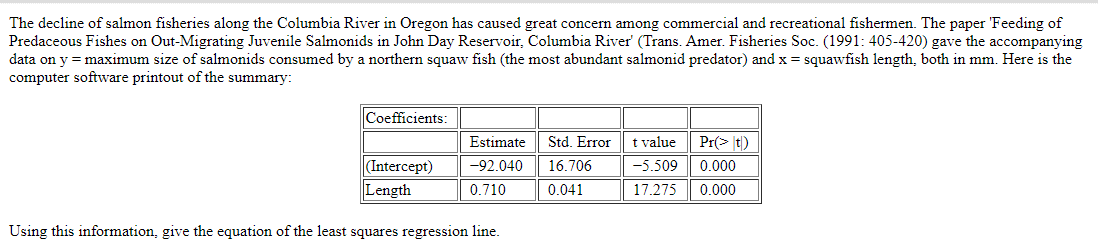
The decline of salmon fisheries along the Columbia River in Oregon has caused great concern among commercial and recreational fishermen. The paper Feeding of Predaceous Fishes on Out-Migrating Juvenile Salmonids in John Day Reservoir, Columbia River' (Trans. Amer. Fisheries Soc. (1991: 405-420) gave the accompanying data on y = maximum size of salmonids consumed by a northern squaw fish (the most abundant salmonid predator) and x = squawfish length, both in mm. Here is the computer software printout of the summary: Coefficients: Estimate Std. Error -92.040 16.706 0.710 0.041 (Intercept) Length Using this information, give the equation of the least squares regression line. t value Pr(> t) -5.509 0.000 17.275 0.000
The decline of salmon fisheries along the Columbia River in Oregon has caused great concern among commercial and recreational fishermen. The paper Feeding of Predaceous Fishes on Out-Migrating Juvenile Salmonids in John Day Reservoir, Columbia River' (Trans. Amer. Fisheries Soc. (1991: 405-420) gave the accompanying data on y = maximum size of salmonids consumed by a northern squaw fish (the most abundant salmonid predator) and x = squawfish length, both in mm. Here is the computer software printout of the summary: Coefficients: Estimate Std. Error -92.040 16.706 0.710 0.041 (Intercept) Length Using this information, give the equation of the least squares regression line. t value Pr(> t) -5.509 0.000 17.275 0.000

MATLAB: An Introduction with Applications
6th Edition
ISBN:9781119256830
Author:Amos Gilat
Publisher:Amos Gilat
Chapter1: Starting With Matlab
Section: Chapter Questions
Problem 1P

Related questions
Question
find the least squares regression line equation from the given data.
Transcribed Image Text:The decline of salmon fisheries along the Columbia River in Oregon has caused great concern among commercial and recreational fishermen. The paper 'Feeding of
Predaceous Fishes on Out-Migrating Juvenile Salmonids in John Day Reservoir, Columbia River' (Trans. Amer. Fisheries Soc. (1991: 405-420) gave the accompanying
data on y = maximum size of salmonids consumed by a northern squaw fish (the most abundant salmonid predator) and x = squawfish length, both in mm. Here is the
computer software printout of the summary:
Coefficients:
(Intercept)
Length
Estimate
-92.040
0.710
Using this information, give the equation of the least squares regression line.
Std. Error
16.706
0.041
t value
-5.509
17.275 0.000
Pr(> t)
0.000
Expert Solution
This question has been solved!
Explore an expertly crafted, step-by-step solution for a thorough understanding of key concepts.

Step by step
Solved in 2 steps

Recommended textbooks for you
MATLAB: An Introduction with Applications
Statistics
ISBN:
9781119256830
Author:
Amos Gilat
Publisher:
John Wiley & Sons Inc

Probability and Statistics for Engineering and th…
Statistics
ISBN:
9781305251809
Author:
Jay L. Devore
Publisher:
Cengage Learning

Statistics for The Behavioral Sciences (MindTap C…
Statistics
ISBN:
9781305504912
Author:
Frederick J Gravetter, Larry B. Wallnau
Publisher:
Cengage Learning
MATLAB: An Introduction with Applications
Statistics
ISBN:
9781119256830
Author:
Amos Gilat
Publisher:
John Wiley & Sons Inc
Probability and Statistics for Engineering and th…
Statistics
ISBN:
9781305251809
Author:
Jay L. Devore
Publisher:
Cengage Learning
Statistics for The Behavioral Sciences (MindTap C…
Statistics
ISBN:
9781305504912
Author:
Frederick J Gravetter, Larry B. Wallnau
Publisher:
Cengage Learning

Elementary Statistics: Picturing the World (7th E…
Statistics
ISBN:
9780134683416
Author:
Ron Larson, Betsy Farber
Publisher:
PEARSON

The Basic Practice of Statistics
Statistics
ISBN:
9781319042578
Author:
David S. Moore, William I. Notz, Michael A. Fligner
Publisher:
W. H. Freeman

Introduction to the Practice of Statistics
Statistics
ISBN:
9781319013387
Author:
David S. Moore, George P. McCabe, Bruce A. Craig
Publisher:
W. H. Freeman