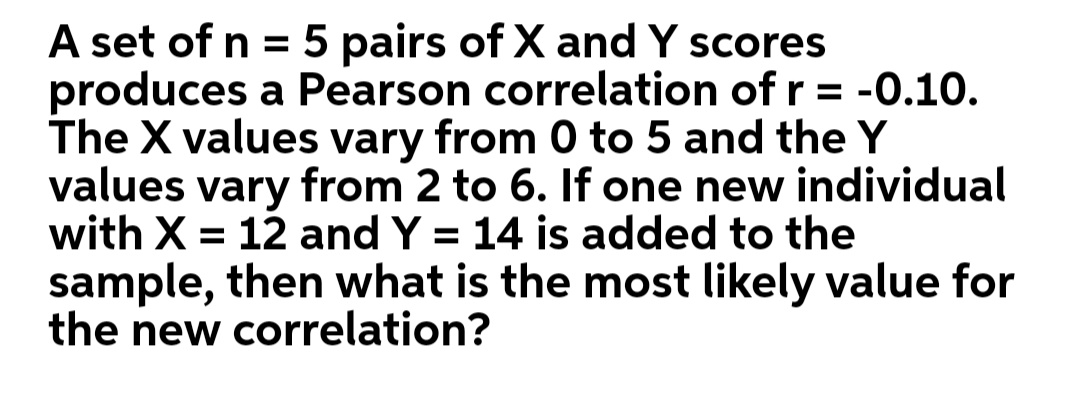
A set of n = 5 pairs of X and Y scores produces a Pearson correlation of r = -0.10. The X values vary from 0 to 5 and the Y values vary from 2 to 6. If one new individual with X = 12 and Y = 14 is added to the sample, then what is the most likely value for the new correlation?
A set of n = 5 pairs of X and Y scores produces a Pearson correlation of r = -0.10. The X values vary from 0 to 5 and the Y values vary from 2 to 6. If one new individual with X = 12 and Y = 14 is added to the sample, then what is the most likely value for the new correlation?

Glencoe Algebra 1, Student Edition, 9780079039897, 0079039898, 2018
18th Edition
ISBN:9780079039897
Author:Carter
Publisher:Carter
Chapter4: Equations Of Linear Functions
Section4.5: Correlation And Causation
Problem 24PFA

Related questions
Question
Transcribed Image Text:A set of n = 5 pairs of X and Y scores
produces a Pearson correlation of r = -0.10.
The X values vary from 0 to 5 and the Y
values vary from 2 to 6. If one new individual
with X = 12 and Y = 14 is added to the
sample, then what is the most likely value for
the new correlation?
%3D
Expert Solution
This question has been solved!
Explore an expertly crafted, step-by-step solution for a thorough understanding of key concepts.

This is a popular solution!

Trending now
This is a popular solution!

Step by step
Solved in 2 steps

Recommended textbooks for you
Glencoe Algebra 1, Student Edition, 9780079039897…
Algebra
ISBN:
9780079039897
Author:
Carter
Publisher:
McGraw Hill
Glencoe Algebra 1, Student Edition, 9780079039897…
Algebra
ISBN:
9780079039897
Author:
Carter
Publisher:
McGraw Hill