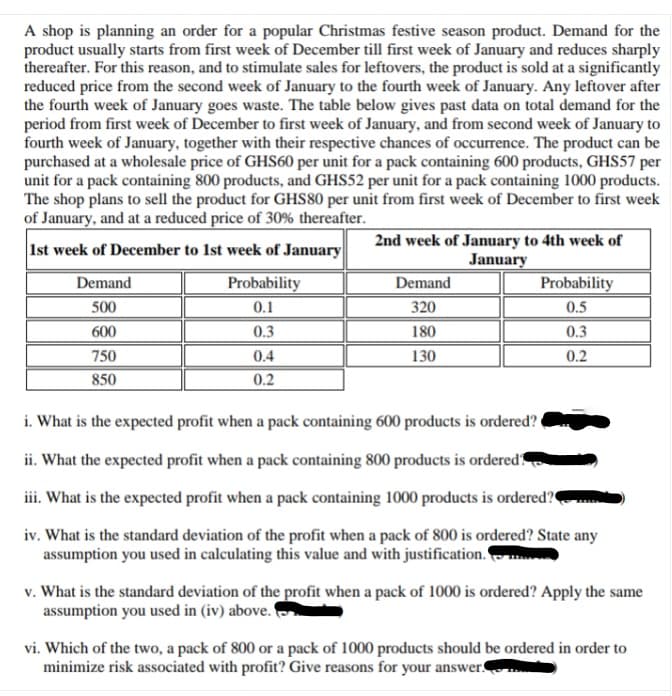
A shop is planning an order for a popular Christmas festive season product. Demand for the product usually starts from first week of December till first week of January and reduces sharply thereafter. For this reason, and to stimulate sales for leftovers, the product is sold at a significantly reduced price from the second week of January to the fourth week of January. Any leftover after the fourth week of January goes waste. The table below gives past data on total demand for the period from first week of December to first week of January, and from second week of January to fourth week of January, together with their respective chances of occurrence. The product can be purchased at a wholesale price of GHS60 per unit for a pack containing 600 products, GHS57 per unit for a pack containing 800 products, and GHS52 per unit for a pack containing 1000 products. The shop plans to sell the product for GHS80 per unit from first week of December to first week of January, and at a reduced price of 30% thereafter. Ist week of December to 1st week of January 2nd week of January to 4th week of January Demand Probability Demand Probability 0.5 500 0.1 320 600 0.3 180 0.3 750 0.4 130 0.2 850 0.2 i. What is the expected profit when a pack containing 600 products is ordered? ii. What the expected profit when a pack containing 800 products is ordered iii. What is the expected profit when a pack containing 1000 products is ordered? iv. What is the standard deviation of the profit when a pack of 800 is ordered? State any assumption you used in calculating this value and with justification. v. What is the standard deviation of the profit when a pack of 1000 is ordered? Apply the same assumption you used in (iv) above. vi. Which of the two, a pack of 800 or a pack of 1000 products should be ordered in order to minimize risk associated with profit? Give reasons for your answer.
A shop is planning an order for a popular Christmas festive season product. Demand for the product usually starts from first week of December till first week of January and reduces sharply thereafter. For this reason, and to stimulate sales for leftovers, the product is sold at a significantly reduced price from the second week of January to the fourth week of January. Any leftover after the fourth week of January goes waste. The table below gives past data on total demand for the period from first week of December to first week of January, and from second week of January to fourth week of January, together with their respective chances of occurrence. The product can be purchased at a wholesale price of GHS60 per unit for a pack containing 600 products, GHS57 per unit for a pack containing 800 products, and GHS52 per unit for a pack containing 1000 products. The shop plans to sell the product for GHS80 per unit from first week of December to first week of January, and at a reduced price of 30% thereafter. Ist week of December to 1st week of January 2nd week of January to 4th week of January Demand Probability Demand Probability 0.5 500 0.1 320 600 0.3 180 0.3 750 0.4 130 0.2 850 0.2 i. What is the expected profit when a pack containing 600 products is ordered? ii. What the expected profit when a pack containing 800 products is ordered iii. What is the expected profit when a pack containing 1000 products is ordered? iv. What is the standard deviation of the profit when a pack of 800 is ordered? State any assumption you used in calculating this value and with justification. v. What is the standard deviation of the profit when a pack of 1000 is ordered? Apply the same assumption you used in (iv) above. vi. Which of the two, a pack of 800 or a pack of 1000 products should be ordered in order to minimize risk associated with profit? Give reasons for your answer.

Practical Management Science
6th Edition
ISBN:9781337406659
Author:WINSTON, Wayne L.
Publisher:WINSTON, Wayne L.
Chapter2: Introduction To Spreadsheet Modeling
Section: Chapter Questions
Problem 33P: Assume the demand for a companys drug Wozac during the current year is 50,000, and assume demand...

Related questions
Question
Transcribed Image Text:A shop is planning an order for a popular Christmas festive season product. Demand for the
product usually starts from first week of December till first week of January and reduces sharply
thereafter. For this reason, and to stimulate sales for leftovers, the product is sold at a significantly
reduced price from the second week of January to the fourth week of January. Any leftover after
the fourth week of January goes waste. The table below gives past data on total demand for the
period from first week of December to first week of January, and from second week of January to
fourth week of January, together with their respective chances of occurrence. The product can be
purchased at a wholesale price of GHS60 per unit for a pack containing 600 products, GHS57 per
unit for a pack containing 800 products, and GHS52 per unit for a pack containing 1000 products.
The shop plans to sell the product for GHS80 per unit from first week of December to first week
of January, and at a reduced price of 30% thereafter.
Ist week of December to 1st week of January
2nd week of January to 4th week of
January
Demand
Probability
Demand
Probability
0.5
500
0.1
320
600
0.3
180
0.3
750
0.4
130
0.2
850
0.2
i. What is the expected profit when a pack containing 600 products is ordered?
ii. What the expected profit when a pack containing 800 products is ordered
iii. What is the expected profit when a pack containing 1000 products is ordered?
iv. What is the standard deviation of the profit when a pack of 800 is ordered? State any
assumption you used in calculating this value and with justification.
v. What is the standard deviation of the profit when a pack of 1000 is ordered? Apply the same
assumption you used in (iv) above.
vi. Which of the two, a pack of 800 or a pack of 1000 products should be ordered in order to
minimize risk associated with profit? Give reasons for your answer.
Expert Solution
This question has been solved!
Explore an expertly crafted, step-by-step solution for a thorough understanding of key concepts.

Step by step
Solved in 5 steps

Recommended textbooks for you
Practical Management Science
Operations Management
ISBN:
9781337406659
Author:
WINSTON, Wayne L.
Publisher:
Cengage,
Practical Management Science
Operations Management
ISBN:
9781337406659
Author:
WINSTON, Wayne L.
Publisher:
Cengage,