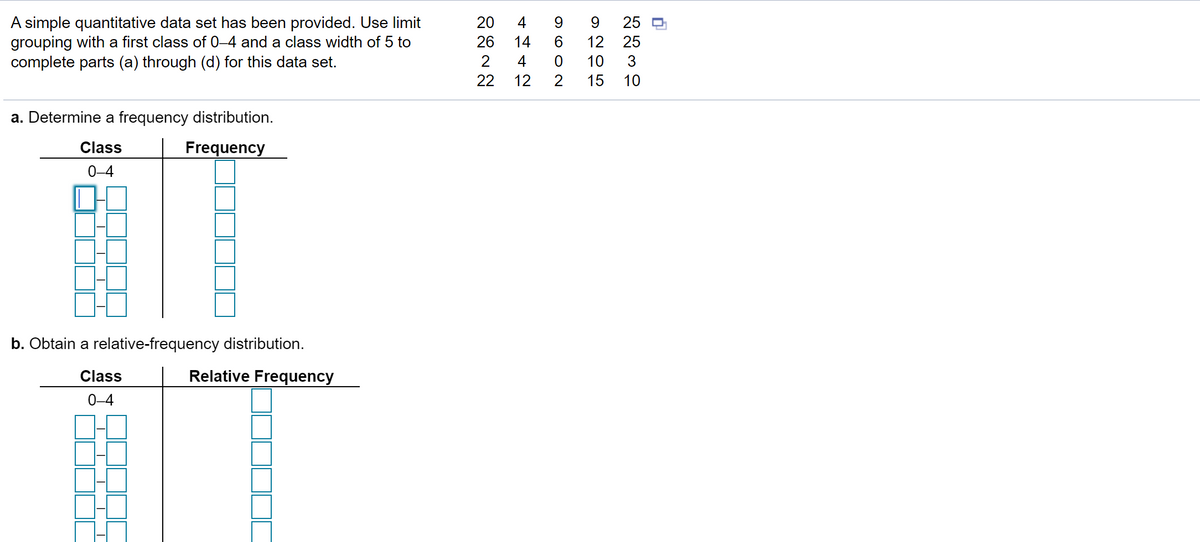
A simple quantitative data set has been provided. Use limit grouping with a first class of 0-4 and a class width of 5 to complete parts (a) through (d) for this data set. 20 4 9. 9 25 26 14 12 25 10 2 4. 22 12 15 10
A simple quantitative data set has been provided. Use limit grouping with a first class of 0-4 and a class width of 5 to complete parts (a) through (d) for this data set. 20 4 9. 9 25 26 14 12 25 10 2 4. 22 12 15 10

Mathematics For Machine Technology
8th Edition
ISBN:9781337798310
Author:Peterson, John.
Publisher:Peterson, John.
Chapter29: Tolerance, Clearance, And Interference
Section: Chapter Questions
Problem 16A: Spacers are manufactured to the mean dimension and tolerance shown in Figure 29-12. An inspector...

Related questions
Topic Video
Question
Transcribed Image Text:A simple quantitative data set has been provided. Use limit
grouping with a first class of 0–4 and a class width of 5 to
complete parts (a) through (d) for this data set.
20
4
9.
9.
25 D
26
14
12
25
2
4
10
3
22
12
15
10
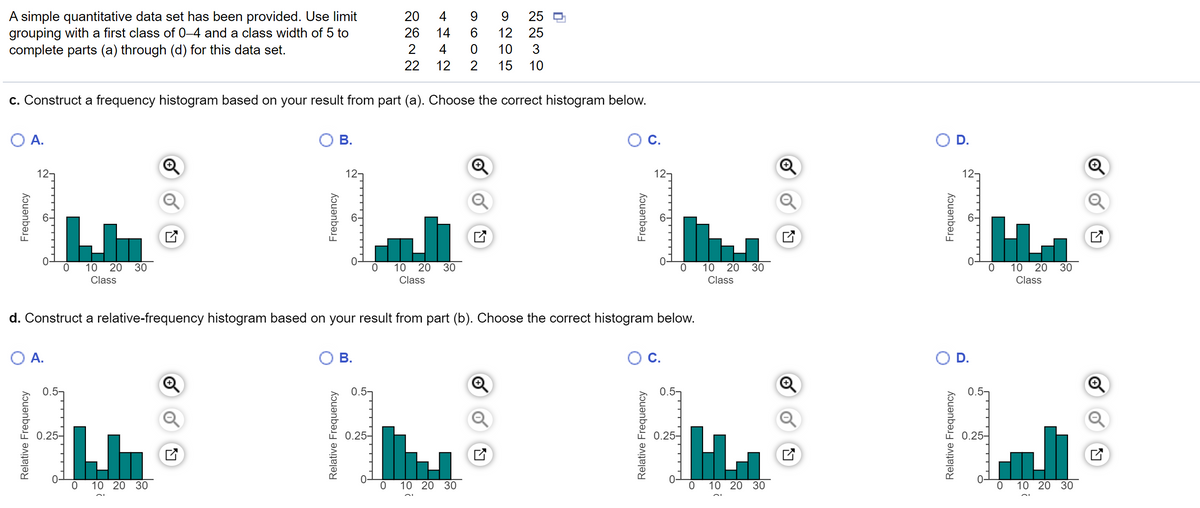
c. Construct a frequency histogram based on your result from part (a). Choose the correct histogram below.
OA.
О В.
C.
D.
12-
12-
12-
12-
10 20
30
10
20
30
10
20
30
10 20
30
Class
Class
Class
Class
d. Construct a relative-frequency histogram based on your result from part (b). Choose the correct histogram below.
O A.
В.
C.
D.
0.5-
0.5
0.25-
0.25-
0.25-
0.25-
10 20 30
10 20 30
10 20 30
10 20 30
Relative Frequency
Frequency
Relative Frequency
Frequency
Relative Frequency
Frequency
Relative Frequency
Frequency
Transcribed Image Text:A simple quantitative data set has been provided. Use limit
grouping with a first class of 0–4 and a class width of 5 to
complete parts (a) through (d) for this data set.
20
4
9.
9.
25
26
14
12 25
4
10
3
22
12
15
10
a. Determine a frequency distribution.
Class
Frequency
0-4
b. Obtain a relative-frequency distribution.
Class
Relative Frequency
0-4
Expert Solution
This question has been solved!
Explore an expertly crafted, step-by-step solution for a thorough understanding of key concepts.

This is a popular solution!

Trending now
This is a popular solution!

Step by step
Solved in 2 steps

Knowledge Booster


Learn more about
Need a deep-dive on the concept behind this application? Look no further. Learn more about this topic, statistics and related others by exploring similar questions and additional content below.Recommended textbooks for you
Mathematics For Machine Technology
Advanced Math
ISBN:
9781337798310
Author:
Peterson, John.
Publisher:
Cengage Learning,
Mathematics For Machine Technology
Advanced Math
ISBN:
9781337798310
Author:
Peterson, John.
Publisher:
Cengage Learning,