A simulated exercise gave n = 29 observations on escape time (sec) for oil workers, from which the sample mean and sample standard deviation are 372.07 and 23.7, respectively. Suppose th investigators had believed a priori that true average escape time would be at most 6 min. Does the data contradict this prior belief? Assuming normality, test the appropriate hypotheses using significance level of 0.05. n USE SALT State the appropriate hypotheses. O Ho: H = 360 He: H< 360 O Ho: H = 360 Ha: us 360 O Ho: H = 360 Ha: u + 360 O Ho: H = 36o H: 4 > 360 Calculate the test statistic and determine the P-value. (Round your test statistic to two decimal places and your P-value to three decimal places.) Pavalue
A simulated exercise gave n = 29 observations on escape time (sec) for oil workers, from which the sample mean and sample standard deviation are 372.07 and 23.7, respectively. Suppose th investigators had believed a priori that true average escape time would be at most 6 min. Does the data contradict this prior belief? Assuming normality, test the appropriate hypotheses using significance level of 0.05. n USE SALT State the appropriate hypotheses. O Ho: H = 360 He: H< 360 O Ho: H = 360 Ha: us 360 O Ho: H = 360 Ha: u + 360 O Ho: H = 36o H: 4 > 360 Calculate the test statistic and determine the P-value. (Round your test statistic to two decimal places and your P-value to three decimal places.) Pavalue

MATLAB: An Introduction with Applications
6th Edition
ISBN:9781119256830
Author:Amos Gilat
Publisher:Amos Gilat
Chapter1: Starting With Matlab
Section: Chapter Questions
Problem 1P

Related questions
Topic Video
Question
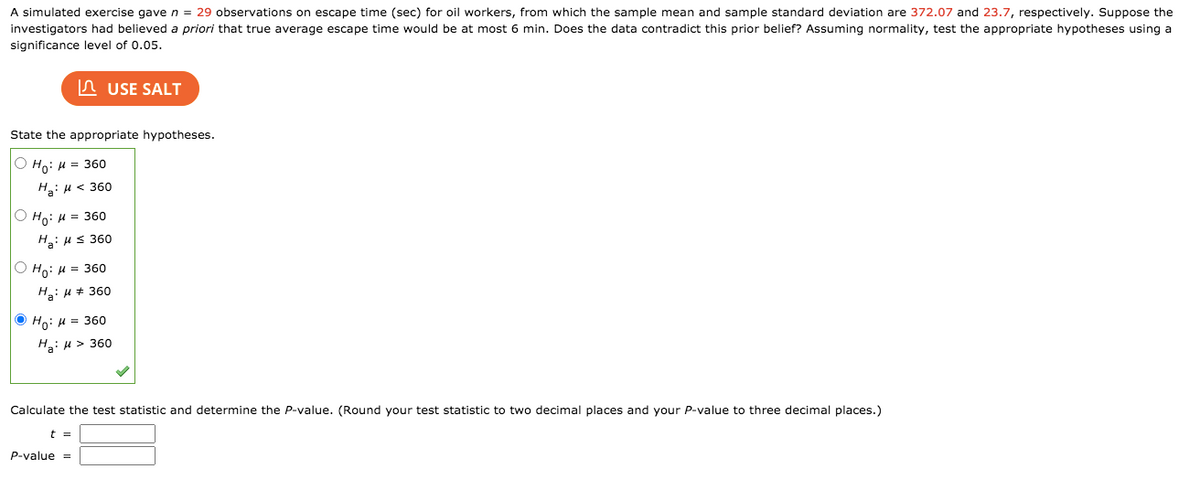
Transcribed Image Text:A simulated exercise gave n = 29 observations on escape time (sec) for oil workers, from which the sample mean and sample standard deviation are 372.07 and 23.7, respectively. Suppose the
investigators had believed a priori that true average escape time would be at most 6 min. Does the data contradict this prior belief? Assuming normality, test the appropriate hypotheses using a
significance level of 0.05.
In USE SALT
State the appropriate hypotheses.
O Ho: H = 360
H: u < 360
O Ho: H = 360
H: us 360
O Ho: H = 360
H: u + 360
O Ho: H = 360
H: H > 360
Calculate the test statistic and determine the P-value. (Round your test statistic to two decimal places and your P-value to three decimal places.)
t =
P-value =
Expert Solution
This question has been solved!
Explore an expertly crafted, step-by-step solution for a thorough understanding of key concepts.

This is a popular solution!

Trending now
This is a popular solution!

Step by step
Solved in 2 steps

Knowledge Booster


Learn more about
Need a deep-dive on the concept behind this application? Look no further. Learn more about this topic, statistics and related others by exploring similar questions and additional content below.Recommended textbooks for you
MATLAB: An Introduction with Applications
Statistics
ISBN:
9781119256830
Author:
Amos Gilat
Publisher:
John Wiley & Sons Inc

Probability and Statistics for Engineering and th…
Statistics
ISBN:
9781305251809
Author:
Jay L. Devore
Publisher:
Cengage Learning

Statistics for The Behavioral Sciences (MindTap C…
Statistics
ISBN:
9781305504912
Author:
Frederick J Gravetter, Larry B. Wallnau
Publisher:
Cengage Learning
MATLAB: An Introduction with Applications
Statistics
ISBN:
9781119256830
Author:
Amos Gilat
Publisher:
John Wiley & Sons Inc
Probability and Statistics for Engineering and th…
Statistics
ISBN:
9781305251809
Author:
Jay L. Devore
Publisher:
Cengage Learning
Statistics for The Behavioral Sciences (MindTap C…
Statistics
ISBN:
9781305504912
Author:
Frederick J Gravetter, Larry B. Wallnau
Publisher:
Cengage Learning

Elementary Statistics: Picturing the World (7th E…
Statistics
ISBN:
9780134683416
Author:
Ron Larson, Betsy Farber
Publisher:
PEARSON

The Basic Practice of Statistics
Statistics
ISBN:
9781319042578
Author:
David S. Moore, William I. Notz, Michael A. Fligner
Publisher:
W. H. Freeman

Introduction to the Practice of Statistics
Statistics
ISBN:
9781319013387
Author:
David S. Moore, George P. McCabe, Bruce A. Craig
Publisher:
W. H. Freeman