A soccer ball's motion is captured using a motion detector and displayed on the graph shown. Use the graph to answer the following questions. Right is defined as positive. Answers have a 5% tolerance to allow for estimation.
A soccer ball's motion is captured using a motion detector and displayed on the graph shown. Use the graph to answer the following questions. Right is defined as positive. Answers have a 5% tolerance to allow for estimation.

Glencoe Physics: Principles and Problems, Student Edition
1st Edition
ISBN:9780078807213
Author:Paul W. Zitzewitz
Publisher:Paul W. Zitzewitz
Chapter3: Accelerated Motion
Section3.2: Motion With Constant Acceleration
Problem 29PP

Related questions

Question
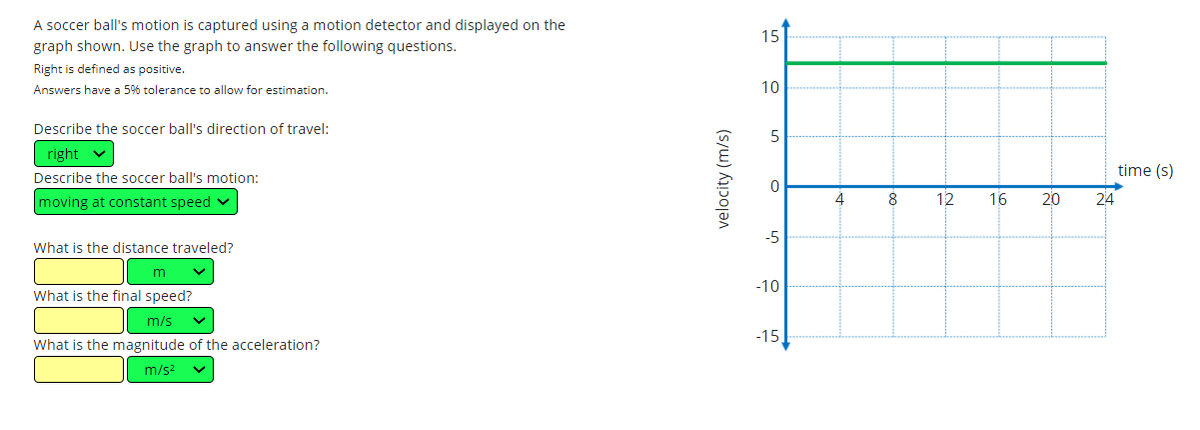
Transcribed Image Text:A soccer ball's motion is captured using a motion detector and displayed on the
15
graph shown. Use the graph to answer the following questions.
Right is defined as positive.
Answers have a 5% tolerance to allow for estimation.
10
Describe the soccer ball's direction of travel:
right
time (s)
Describe the soccer ball's motion:
moving at constant speed v
4
8
12
16
20
24
-5
What is the distance traveled?
-10
What is the final speed?
m/s
-15
What is the magnitude of the acceleration?
m/s2
velocity (m/s)
Expert Solution
This question has been solved!
Explore an expertly crafted, step-by-step solution for a thorough understanding of key concepts.

This is a popular solution!

Trending now
This is a popular solution!

Step by step
Solved in 2 steps with 2 images

Knowledge Booster


Learn more about
Need a deep-dive on the concept behind this application? Look no further. Learn more about this topic, physics and related others by exploring similar questions and additional content below.Recommended textbooks for you
Glencoe Physics: Principles and Problems, Student…
Physics
ISBN:
9780078807213
Author:
Paul W. Zitzewitz
Publisher:
Glencoe/McGraw-Hill
Glencoe Physics: Principles and Problems, Student…
Physics
ISBN:
9780078807213
Author:
Paul W. Zitzewitz
Publisher:
Glencoe/McGraw-Hill