A social service organization reports that the level of educational attainment of mothers receiving food stamps is uniformly distributed. To test this claim, you randomly select 96 mothers who currently receive food stamps and record the educational attainment of each. The results are shown in the table on the right. At a = 0.025, can you reject the claim that the distribution is uniform? Complete parts (a) through (d) below. Frequency, f Response Not a high school graduate High school graduate College (1 year or more) 36 37 23 (a) State Ho and H, and identify the claim. Ho: The distribution of educational attainment responses is Ha: The distribution of educational attainment responses is Which hypothesis is the claim? O Ho На (b) Determine the critical value, Xo, and the rejection region. Xo =(Round to three decimal places as needed.) Choose the correct rejection region below. O A. XXo OD. X2x% (c) Calculate the test statistic. y* = (Round to three decimal places as needed.)
A social service organization reports that the level of educational attainment of mothers receiving food stamps is uniformly distributed. To test this claim, you randomly select 96 mothers who currently receive food stamps and record the educational attainment of each. The results are shown in the table on the right. At a = 0.025, can you reject the claim that the distribution is uniform? Complete parts (a) through (d) below. Frequency, f Response Not a high school graduate High school graduate College (1 year or more) 36 37 23 (a) State Ho and H, and identify the claim. Ho: The distribution of educational attainment responses is Ha: The distribution of educational attainment responses is Which hypothesis is the claim? O Ho На (b) Determine the critical value, Xo, and the rejection region. Xo =(Round to three decimal places as needed.) Choose the correct rejection region below. O A. XXo OD. X2x% (c) Calculate the test statistic. y* = (Round to three decimal places as needed.)

Glencoe Algebra 1, Student Edition, 9780079039897, 0079039898, 2018
18th Edition
ISBN:9780079039897
Author:Carter
Publisher:Carter
Chapter10: Statistics
Section10.4: Distributions Of Data
Problem 19PFA

Related questions
Question
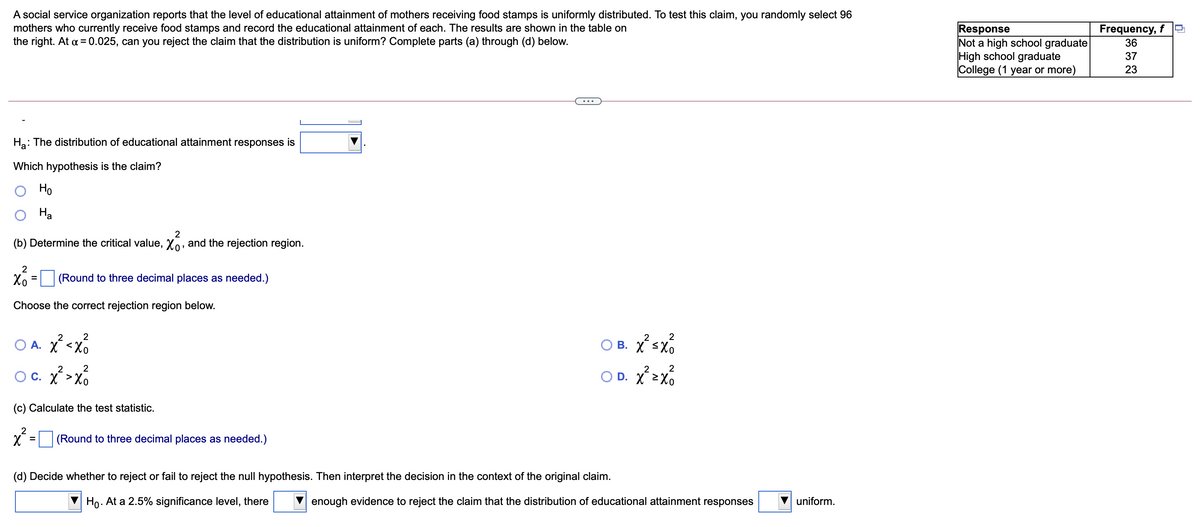
Transcribed Image Text:A social service organization reports that the level of educational attainment of mothers receiving food stamps is uniformly distributed. To test this claim, you randomly select 96
mothers who currently receive food stamps and record the educational attainment of each. The results are shown in the table on
the right. At a = 0.025, can you reject the claim that the distribution is uniform? Complete parts (a) through (d) below.
Response
Not a high school graduate
High school graduate
College (1 year or more)
Frequency, f
36
37
23
...
Ha: The distribution of educational attainment responses is
Which hypothesis is the claim?
Но
На
(b) Determine the critical value, Xo, and the rejection region.
Xo
(Round to three decimal places as needed.)
Choose the correct rejection region below.
2
2
O B. Xsx
2
2
A. X <Xo
2
2
2
2
O C. X >Xo
O D. X 2X0
(c) Calculate the test statistic.
2
(Round to three decimal places as needed.)
(d) Decide whether to reject or fail to reject the null hypothesis. Then interpret the decision in the context of the original claim.
Họ. At a 2.5% significance level, there
enough evidence to reject the claim that the distribution of educational attainment responses
uniform.
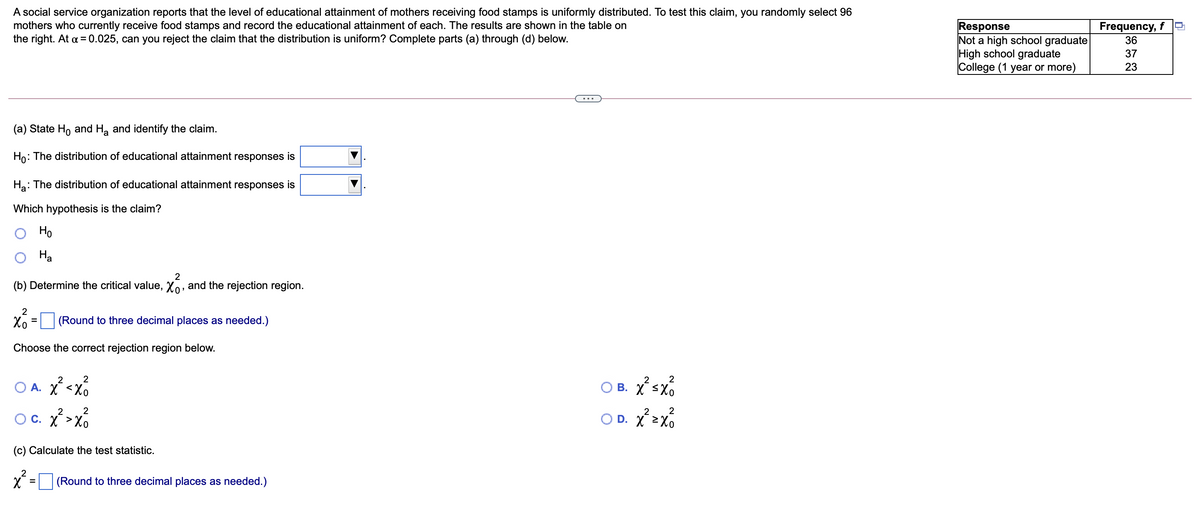
Transcribed Image Text:A social service organization reports that the level of educational attainment of mothers receiving food stamps is uniformly distributed. To test this claim, you randomly select 96
mothers who currently receive food stamps and record the educational attainment of each. The results are shown in the table on
the right. At a = 0.025, can you reject the claim that the distribution is uniform? Complete parts (a) through (d) below.
Frequency, f
Response
Not a high school graduate
High school graduate
College (1 year or more)
36
37
23
(a) State Ho and H, and identify the claim.
Ho:
: The distribution of educational attainment responses is
Ha: The distribution of educational attainment responses is
Which hypothesis is the claim?
Но
На
2
(b) Determine the critical value, Xo, and the rejection region.
2
Xo
(Round to three decimal places as needed.)
%3D
Choose the correct rejection region below.
2
O A. X <Xo
2
2
O B. X<Xo
2
2
OC. X >Xo
O D. X2x%
(c) Calculate the test statistic.
X = (Round to three decimal places as needed.)
Expert Solution
This question has been solved!
Explore an expertly crafted, step-by-step solution for a thorough understanding of key concepts.

This is a popular solution!

Trending now
This is a popular solution!

Step by step
Solved in 4 steps

Recommended textbooks for you
Glencoe Algebra 1, Student Edition, 9780079039897…
Algebra
ISBN:
9780079039897
Author:
Carter
Publisher:
McGraw Hill
Glencoe Algebra 1, Student Edition, 9780079039897…
Algebra
ISBN:
9780079039897
Author:
Carter
Publisher:
McGraw Hill