A social service organization reports that the level mothers who currently receive food stamps and record the educational attainment of each. The results are shown in the table on the right. At a= 0.05, can you reject the claim that the distribution is uniform? Complete parts (a) through (d) below. educational attainment of mothers receiving food stamps is uniformly distributed. To test this claim, you randomly select 99 Response Not a high school graduate High school graduate College (1 year or more) Frequency, f 37 38 24 (a) State Ho and H, and identify the claim. H: The distribution of educational attainment responses is H: The distribution of educational attainment responses is Which hypothesis is the claim? O Ho O H. (b) Determine the critical value, Xp, and the rejection region. X= (Round to three decimal places as needed.) Choose the correct rejection region below. OB. Xx OA X2x Oc. X sx. (c) Calculate the test statistic. X= (Round to three decimal places as needed.)
A social service organization reports that the level mothers who currently receive food stamps and record the educational attainment of each. The results are shown in the table on the right. At a= 0.05, can you reject the claim that the distribution is uniform? Complete parts (a) through (d) below. educational attainment of mothers receiving food stamps is uniformly distributed. To test this claim, you randomly select 99 Response Not a high school graduate High school graduate College (1 year or more) Frequency, f 37 38 24 (a) State Ho and H, and identify the claim. H: The distribution of educational attainment responses is H: The distribution of educational attainment responses is Which hypothesis is the claim? O Ho O H. (b) Determine the critical value, Xp, and the rejection region. X= (Round to three decimal places as needed.) Choose the correct rejection region below. OB. Xx OA X2x Oc. X sx. (c) Calculate the test statistic. X= (Round to three decimal places as needed.)

MATLAB: An Introduction with Applications
6th Edition
ISBN:9781119256830
Author:Amos Gilat
Publisher:Amos Gilat
Chapter1: Starting With Matlab
Section: Chapter Questions
Problem 1P

Related questions
Question
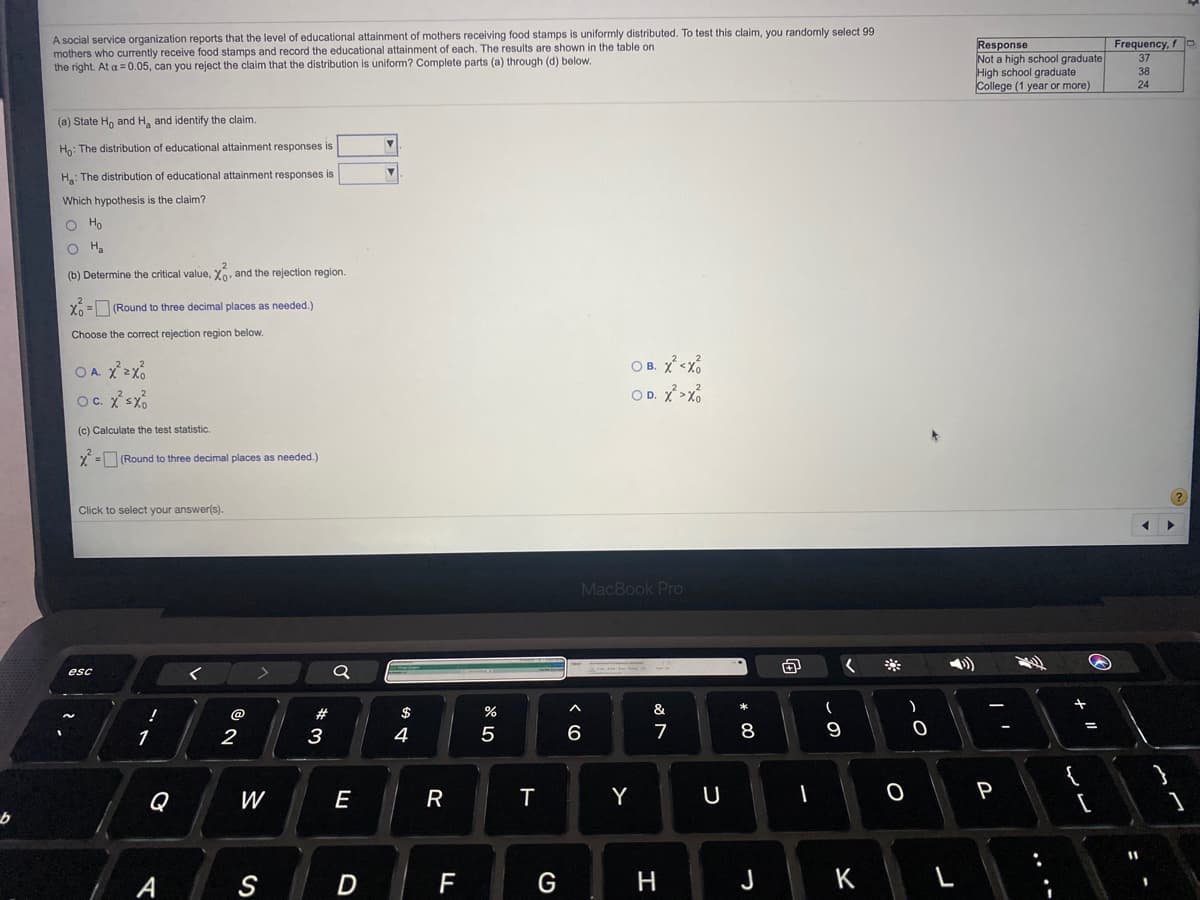
Transcribed Image Text:A social service organization reports that the level of educational attainment of mothers receiving food stamps is uniformly distributed. To test this claim, you randomly select 99
mothers who currently receive food stamps and record the educational attainment of each. The results are shown in the table on
the right. At a =0.05, can you reject the claim that the distribution is uniform? Complete parts (a) through (d) below.
Response
Not a high school graduate
High school graduate
College (1 year or more)
Frequency, f
37
38
24
(a) State H, and H, and identify the claim.
Ho: The distribution of educational attainment responses is
H: The distribution of educational attainment responses is
Which hypothesis is the claim?
O Ho
O H.
(b) Determine the critical value, Xo, and the rejection region.
Xn= (Round to three decimal places as needed.)
Choose the correct rejection region below.
OB. X<x%
OD. X>x
Oc. Xsx.
(c) Calculate the test statistic.
X = (Round to three decimal places as needed.
?
Click to select your answer(s).
MacBook Pro
米
esc
@
$
&
1
2
3
4
6
7
8
9
Q
W
E
R
T
Y
U
P
%3D
A
S
F
G
H
J
K
Expert Solution
This question has been solved!
Explore an expertly crafted, step-by-step solution for a thorough understanding of key concepts.

This is a popular solution!

Trending now
This is a popular solution!

Step by step
Solved in 4 steps with 7 images

Knowledge Booster


Learn more about
Need a deep-dive on the concept behind this application? Look no further. Learn more about this topic, statistics and related others by exploring similar questions and additional content below.Recommended textbooks for you
MATLAB: An Introduction with Applications
Statistics
ISBN:
9781119256830
Author:
Amos Gilat
Publisher:
John Wiley & Sons Inc

Probability and Statistics for Engineering and th…
Statistics
ISBN:
9781305251809
Author:
Jay L. Devore
Publisher:
Cengage Learning

Statistics for The Behavioral Sciences (MindTap C…
Statistics
ISBN:
9781305504912
Author:
Frederick J Gravetter, Larry B. Wallnau
Publisher:
Cengage Learning
MATLAB: An Introduction with Applications
Statistics
ISBN:
9781119256830
Author:
Amos Gilat
Publisher:
John Wiley & Sons Inc
Probability and Statistics for Engineering and th…
Statistics
ISBN:
9781305251809
Author:
Jay L. Devore
Publisher:
Cengage Learning
Statistics for The Behavioral Sciences (MindTap C…
Statistics
ISBN:
9781305504912
Author:
Frederick J Gravetter, Larry B. Wallnau
Publisher:
Cengage Learning

Elementary Statistics: Picturing the World (7th E…
Statistics
ISBN:
9780134683416
Author:
Ron Larson, Betsy Farber
Publisher:
PEARSON

The Basic Practice of Statistics
Statistics
ISBN:
9781319042578
Author:
David S. Moore, William I. Notz, Michael A. Fligner
Publisher:
W. H. Freeman

Introduction to the Practice of Statistics
Statistics
ISBN:
9781319013387
Author:
David S. Moore, George P. McCabe, Bruce A. Craig
Publisher:
W. H. Freeman