A sociologist randomly selects single adults for different groups of three, and the random variable x is the number in the group who say that the most fun way to flirt is in person. Determine whether a probability distribution is given. If a probability distribution is given, find its mean and standard deviation. If a probability distribution is not given, identify the requirements that are not satisfied. Does the table show a probability distribution? Select all that apply. X 0 1 2 3 A. Yes, the table shows a probability distribution. B. No, the sum of all the probabilities is not equal to 1. C. No, not every probability is between 0 and 1 inclusive. D. No, the random variable x's number values are not associated with probabilities. E. No, the random variable x is categorical instead of numerical. A. µ= adult(s) (Round to one decimal place as needed.) B. The table does not show a probability distribution. P(x) 0.094 0.342 0.399 0.165 Find the mean of the random variable x. Select the correct choice below and, if necessary, fill in th answer box to complete your choice. A. 0= adult(s) (Round to one decimal place as needed.) B. The table does not show a probability distribution. Find the standard deviation of the random variable x. Select the correct choice below and, if necessary, fill in the answer box to complete your choice.
A sociologist randomly selects single adults for different groups of three, and the random variable x is the number in the group who say that the most fun way to flirt is in person. Determine whether a probability distribution is given. If a probability distribution is given, find its mean and standard deviation. If a probability distribution is not given, identify the requirements that are not satisfied. Does the table show a probability distribution? Select all that apply. X 0 1 2 3 A. Yes, the table shows a probability distribution. B. No, the sum of all the probabilities is not equal to 1. C. No, not every probability is between 0 and 1 inclusive. D. No, the random variable x's number values are not associated with probabilities. E. No, the random variable x is categorical instead of numerical. A. µ= adult(s) (Round to one decimal place as needed.) B. The table does not show a probability distribution. P(x) 0.094 0.342 0.399 0.165 Find the mean of the random variable x. Select the correct choice below and, if necessary, fill in th answer box to complete your choice. A. 0= adult(s) (Round to one decimal place as needed.) B. The table does not show a probability distribution. Find the standard deviation of the random variable x. Select the correct choice below and, if necessary, fill in the answer box to complete your choice.

Chapter8: Sequences, Series,and Probability
Section8.7: Probability
Problem 11ECP: A manufacturer has determined that a machine averages one faulty unit for every 500 it produces....

Related questions
Question
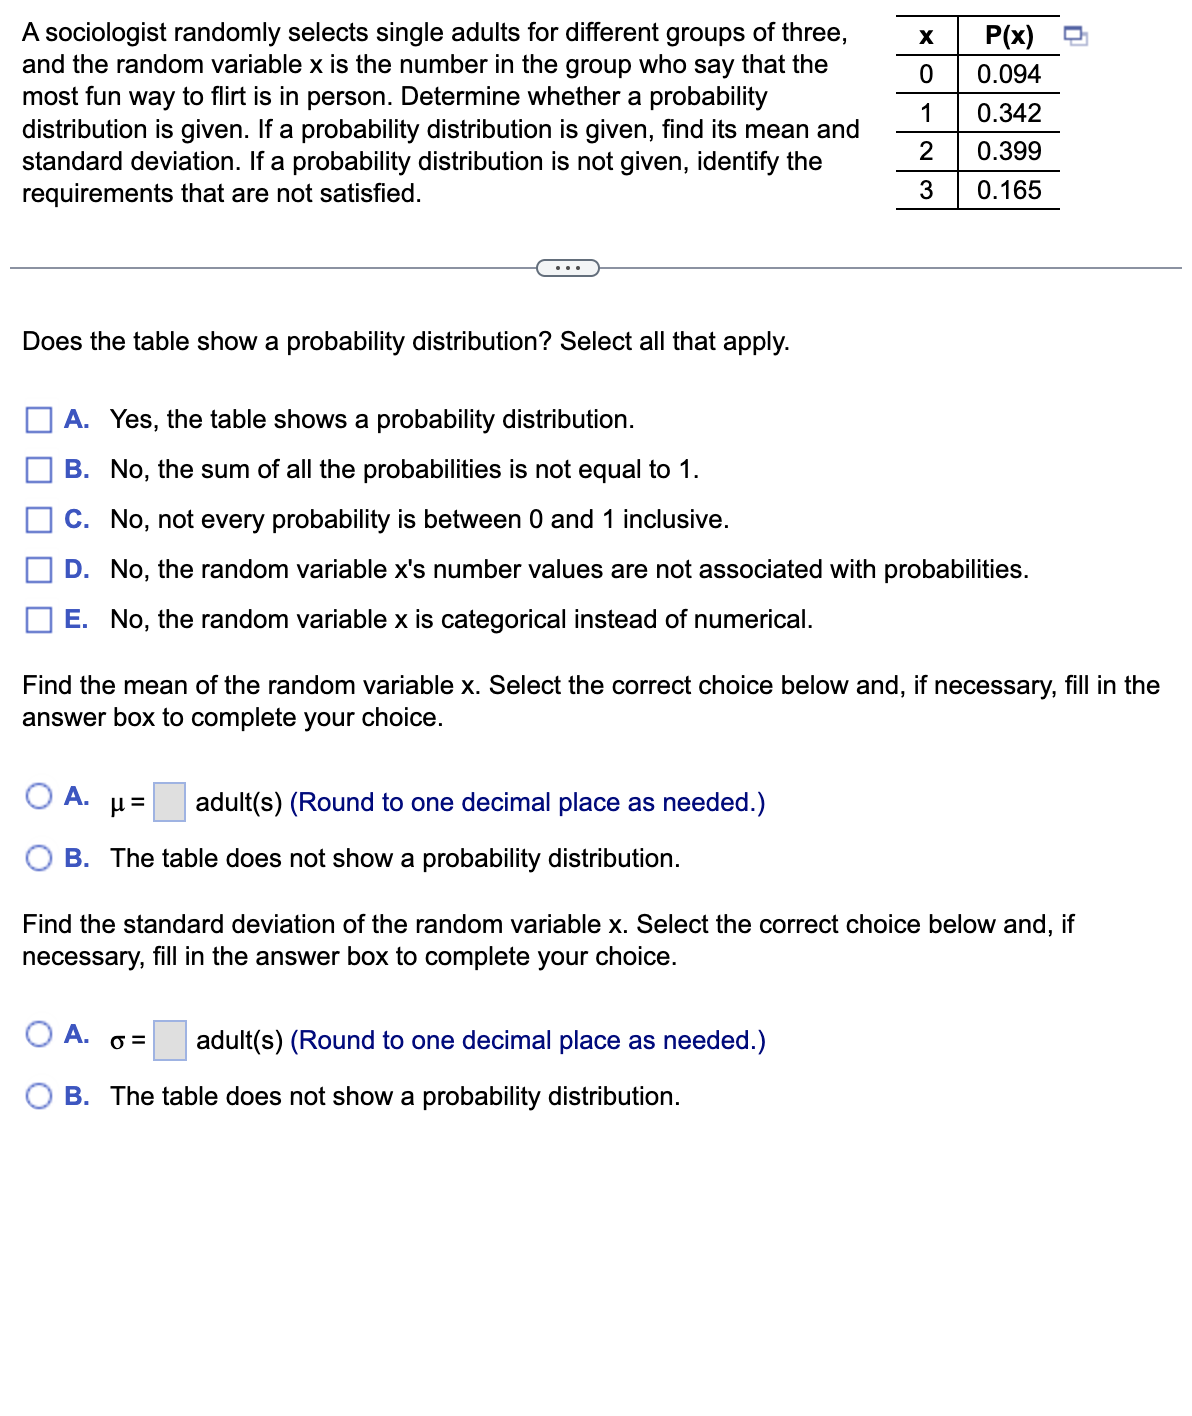
Transcribed Image Text:A sociologist randomly selects single adults for different groups of three,
and the random variable x is the number in the group who say that the
most fun way to flirt is in person. Determine whether a probability
distribution is given. If a probability distribution is given, find its mean and
standard deviation. If a probability distribution is not given, identify the
requirements that are not satisfied.
Does the table show a probability distribution? Select all that apply.
A. Yes, the table shows a probability distribution.
B. No, the sum of all the probabilities is not equal to 1.
C. No, not every probability is between 0 and 1 inclusive.
D. No, the random variable x's number values are not associated with probabilities.
E. No, the random variable x is categorical instead of numerical.
A.
Find the mean of the random variable x. Select the correct choice below and, if necessary, fill in the
answer box to complete your choice.
= 1/
adult(s) (Round to one decimal place as needed.)
B. The table does not show a probability distribution.
A.
X
0
1
2
3
P(x)
0.094
0.342
0.399
0.165
Find the standard deviation of the random variable x. Select the correct choice below and, if
necessary, fill in the answer box to complete your choice.
O= adult(s) (Round to one decimal place as needed.)
B. The table does not show a probability distribution.
Expert Solution
This question has been solved!
Explore an expertly crafted, step-by-step solution for a thorough understanding of key concepts.

Step by step
Solved in 2 steps with 2 images

Recommended textbooks for you