Problem #5

Chapter6: Systems Of Equations And Inequalities
Section: Chapter Questions
Problem 17PS: Cholesterol Cholesterol in human blood is necessary, but too much can lead to health problems. There...

Related questions
Question
100%
Problem #5
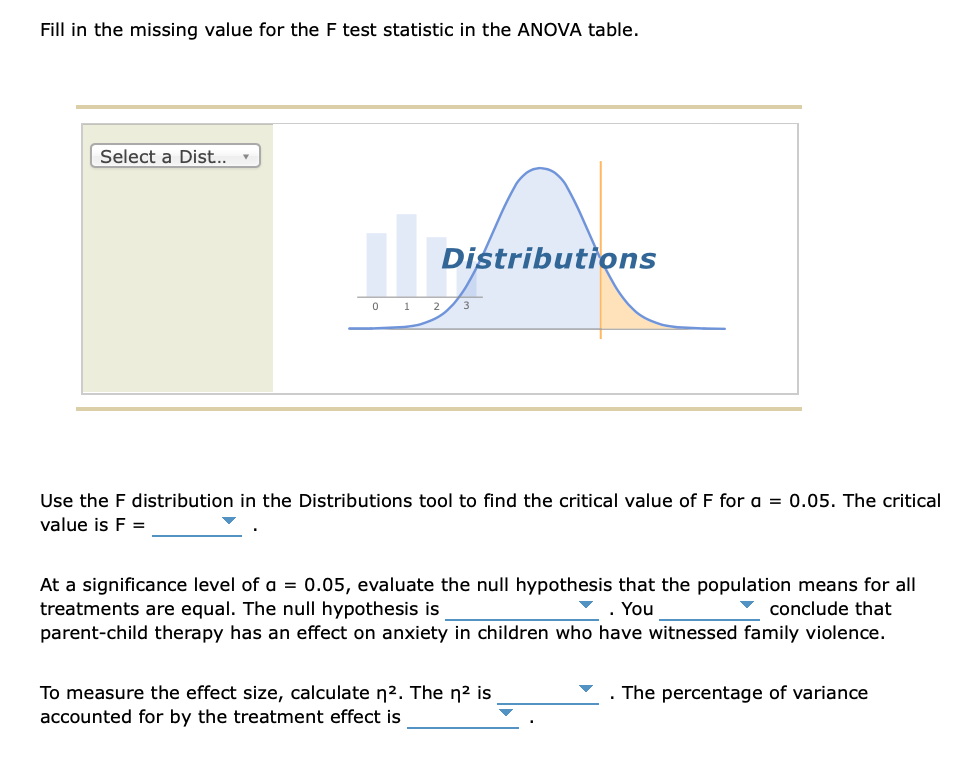
Transcribed Image Text:Fill in the missing value for the F test statistic in the ANOVA table.
Select a Dist... ▾
0 1
Distributions
Use the F distribution in the Distributions tool to find the critical value of F for a = 0.05. The critical
value is F =
At a significance level of a = 0.05, evaluate the null hypothesis that the population means for all
treatments are equal. The null hypothesis is
conclude that
. You
parent-child therapy has an effect on anxiety in children who have witnessed family violence.
To measure the effect size, calculate n². The n² is
accounted for by the treatment effect is
The percentage of variance
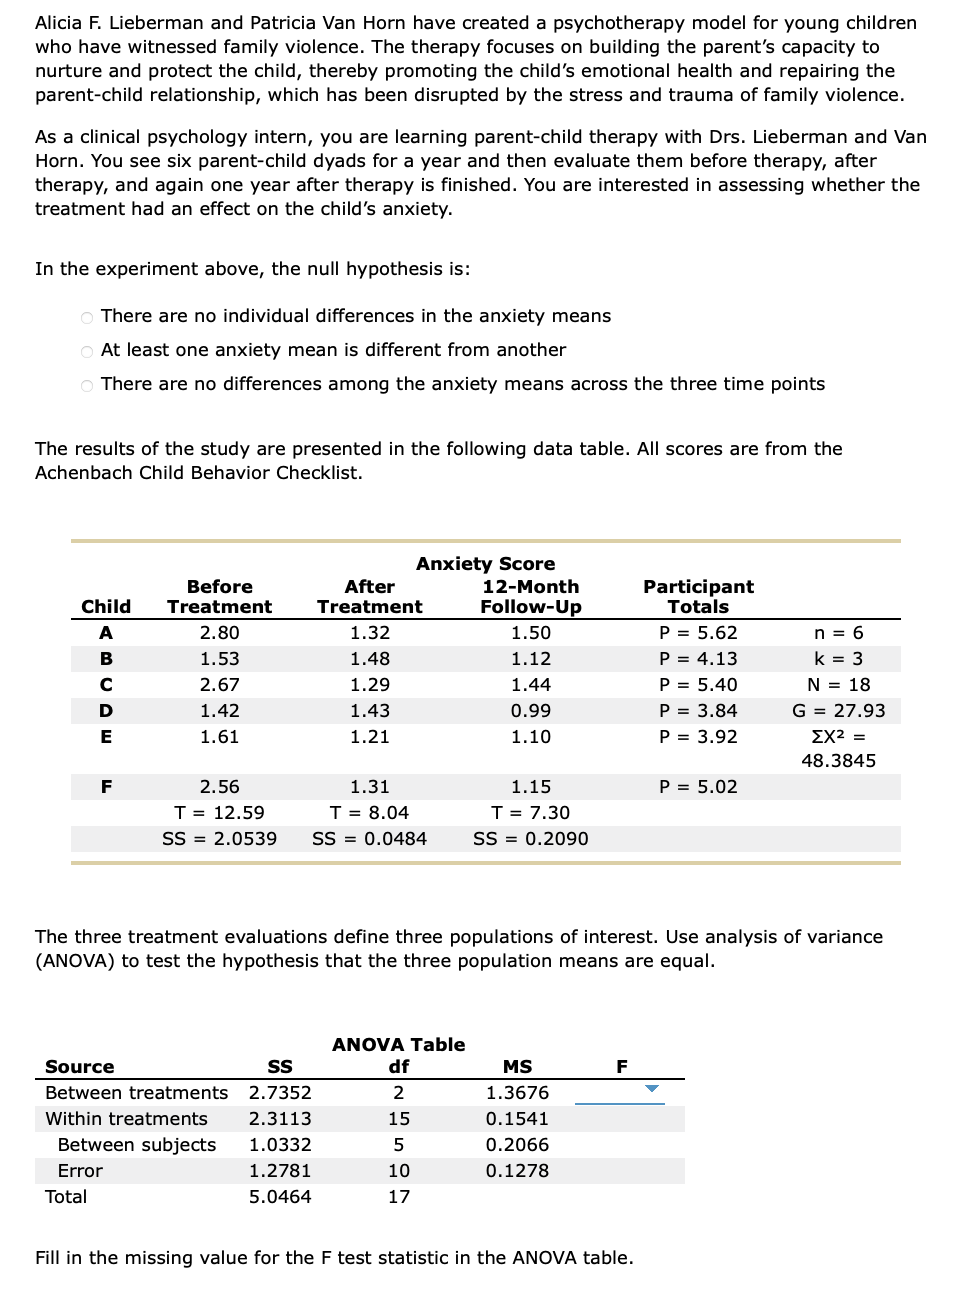
Transcribed Image Text:Alicia F. Lieberman and Patricia Van Horn have created a psychotherapy model for young children
who have witnessed family violence. The therapy focuses on building the parent's capacity to
nurture and protect the child, thereby promoting the child's emotional health and repairing the
parent-child relationship, which has been disrupted by the stress and trauma of family violence.
As a clinical psychology intern, you are learning parent-child therapy with Drs. Lieberman and Van
Horn. You see six parent-child dyads for a year and then evaluate them before therapy, after
therapy, and again one year after therapy is finished. You are interested in assessing whether the
treatment had an effect on the child's anxiety.
In the experiment above, the null hypothesis is:
There are no individual differences in the anxiety means
O At least one anxiety mean is different from another
There are no differences among the anxiety means across the three time points
The results of the study are presented in the following data table. All scores are from the
Achenbach Child Behavior Checklist.
Child
A
B
E
F
Total
Before
Treatment
2.80
1.53
2.67
1.42
1.61
2.56
T = 12.59
SS 2.0539
Source
SS
Between treatments 2.7352
Within treatments
2.3113
1.0332
1.2781
5.0464
Between subjects
Error
Anxiety Score
After
Treatment
1.32
1.48
1.29
1.43
1.21
1.31
T = 8.04
SS=0.0484
12-Month
Follow-Up
1.50
1.12
1.44
0.99
1.10
ANOVA Table
df
2
15
5
10
17
1.15
T = 7.30
SS = 0.2090
MS
1.3676
0.1541
0.2066
0.1278
The three treatment evaluations define three populations of interest. Use analysis of variance
(ANOVA) to test the hypothesis that the three population means are equal.
F
Participant
Totals
Fill in the missing value for the F test statistic in the ANOVA table.
P = 5.62
P = 4.13
P = 5.40
P = 3.84
P = 3.92
P = 5.02
n = 6
k = 3
N = 18
G = 27.93
ΣΧ2 =
48.3845
Expert Solution
This question has been solved!
Explore an expertly crafted, step-by-step solution for a thorough understanding of key concepts.

Step by step
Solved in 2 steps

Recommended textbooks for you

Algebra for College Students
Algebra
ISBN:
9781285195780
Author:
Jerome E. Kaufmann, Karen L. Schwitters
Publisher:
Cengage Learning
Algebra for College Students
Algebra
ISBN:
9781285195780
Author:
Jerome E. Kaufmann, Karen L. Schwitters
Publisher:
Cengage Learning