A sociologist randomly selects single adults for different groups of three, and the random variable x is the number in the group who say that the most fun way to flirt is in person. Determine whether a probability distribution is given. If a probability distribution is given, find its mean and standard deviation. If a probability distribution is not given, identify the requirements that are not satisfied. P(x) O 0.094 1 0.346 2 0.394 3. 0.166 Does the table show a probability distribution? Select all that apply. A. Yes, the table shows a probability distribution. B. No, the sum of all the probabilities is not equal to 1. C. No, the random variable x is categorical instead of numerical. D. No, not every probability is between 0 and 1 inclusive. E. No, the random variable x's number values are not associated with probabilities.
A sociologist randomly selects single adults for different groups of three, and the random variable x is the number in the group who say that the most fun way to flirt is in person. Determine whether a probability distribution is given. If a probability distribution is given, find its mean and standard deviation. If a probability distribution is not given, identify the requirements that are not satisfied. P(x) O 0.094 1 0.346 2 0.394 3. 0.166 Does the table show a probability distribution? Select all that apply. A. Yes, the table shows a probability distribution. B. No, the sum of all the probabilities is not equal to 1. C. No, the random variable x is categorical instead of numerical. D. No, not every probability is between 0 and 1 inclusive. E. No, the random variable x's number values are not associated with probabilities.

Algebra & Trigonometry with Analytic Geometry
13th Edition
ISBN:9781133382119
Author:Swokowski
Publisher:Swokowski
Chapter10: Sequences, Series, And Probability
Section10.8: Probability
Problem 10E

Related questions

Concept explainers
Contingency Table
A contingency table can be defined as the visual representation of the relationship between two or more categorical variables that can be evaluated and registered. It is a categorical version of the scatterplot, which is used to investigate the linear relationship between two variables. A contingency table is indeed a type of frequency distribution table that displays two variables at the same time.
Binomial Distribution
Binomial is an algebraic expression of the sum or the difference of two terms. Before knowing about binomial distribution, we must know about the binomial theorem.
Topic Video
Question
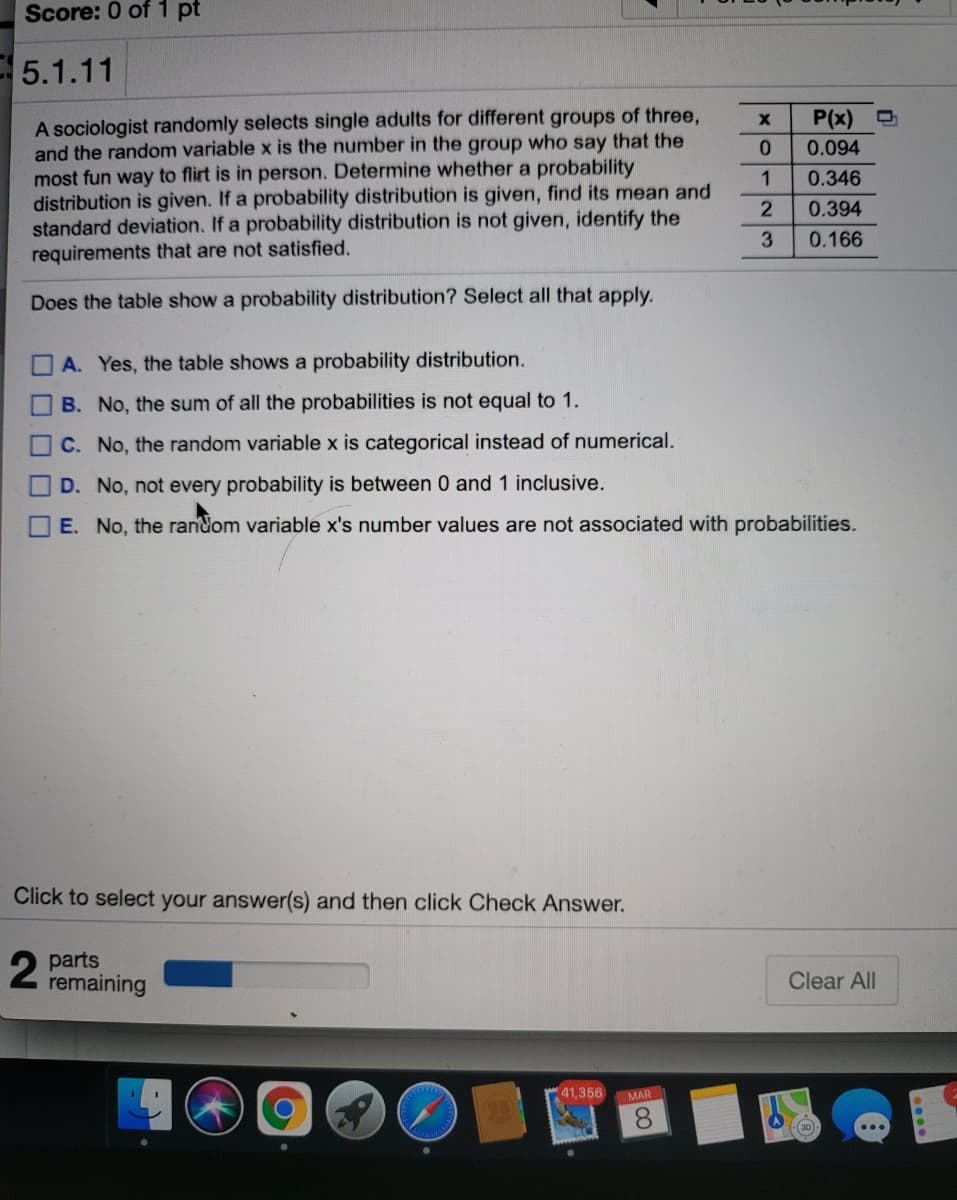
Transcribed Image Text:Score: 0 of 1 pt
5.1.11
A sociologist randomly selects single adults for different groups of three,
and the random variable x is the number in the group who say that the
most fun way to flirt is in person. Determine whether a probability
distribution is given. If a probability distribution is given, find its mean and
standard deviation. If a probability distribution is not given, identify the
requirements that are not satisfied.
P(x)
0.094
0.346
0.394
3
0.166
Does the table show a probability distribution? Select all that apply.
A. Yes, the table shows a probability distribution.
B. No, the sum of all the probabilities is not equal to 1.
C. No, the random variable x is categorical instead of numerical.
D. No, not every probability is between 0 and 1 inclusive.
E. No, the random variable x's number values are not associated with probabilities.
Click to select your answer(s) and then click Check Answer.
parts
remaining
Clear All
41,356 MAR
8.
(30)
OO.00O
Expert Solution
This question has been solved!
Explore an expertly crafted, step-by-step solution for a thorough understanding of key concepts.

This is a popular solution!

Trending now
This is a popular solution!

Step by step
Solved in 2 steps with 2 images

Knowledge Booster


Learn more about
Need a deep-dive on the concept behind this application? Look no further. Learn more about this topic, statistics and related others by exploring similar questions and additional content below.Recommended textbooks for you
Algebra & Trigonometry with Analytic Geometry
Algebra
ISBN:
9781133382119
Author:
Swokowski
Publisher:
Cengage
Algebra & Trigonometry with Analytic Geometry
Algebra
ISBN:
9781133382119
Author:
Swokowski
Publisher:
Cengage