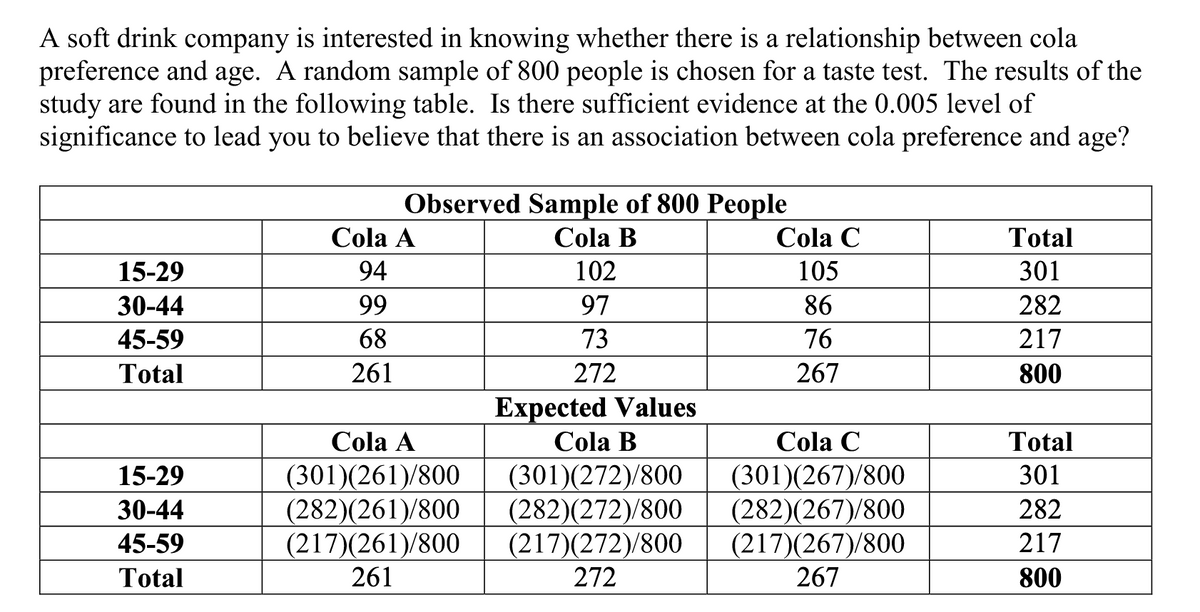
A soft drink company is interested in knowing whether there is a relationship between cola preference and age. A random sample of 800 people is chosen for a taste test. The results of the study are found in the following table. Is there sufficient evidence at the 0.005 level of significance to lead you to believe that there is an association between cola preference and age? Observed Sample of 800 People Cola A Cola B Cola C Total 15-29 94 102 105 301 30-44 99 97 86 282 45-59 68 73 76 217 Total 261 272 267 800 Expected Values Cola B Cola A Cola C Total (301)(261)/800 (282)(261)/800 (217)(261)/800 261 15-29 (301)(272)/800 (282)(272)/800 (217)(272)/800 272 (301)(267)/800 (282)(267)/800 (217)(267)/800 267 301 30-44 282 45-59 217 Total 800
A soft drink company is interested in knowing whether there is a relationship between cola preference and age. A random sample of 800 people is chosen for a taste test. The results of the study are found in the following table. Is there sufficient evidence at the 0.005 level of significance to lead you to believe that there is an association between cola preference and age? Observed Sample of 800 People Cola A Cola B Cola C Total 15-29 94 102 105 301 30-44 99 97 86 282 45-59 68 73 76 217 Total 261 272 267 800 Expected Values Cola B Cola A Cola C Total (301)(261)/800 (282)(261)/800 (217)(261)/800 261 15-29 (301)(272)/800 (282)(272)/800 (217)(272)/800 272 (301)(267)/800 (282)(267)/800 (217)(267)/800 267 301 30-44 282 45-59 217 Total 800

Holt Mcdougal Larson Pre-algebra: Student Edition 2012
1st Edition
ISBN:9780547587776
Author:HOLT MCDOUGAL
Publisher:HOLT MCDOUGAL
Chapter11: Data Analysis And Probability
Section: Chapter Questions
Problem 8CR

Related questions
Topic Video
Question
Transcribed Image Text:A soft drink company is interested in knowing whether there is a relationship between cola
preference and age. A random sample of 800 people is chosen for a taste test. The results of the
study are found in the following table. Is there sufficient evidence at the 0.005 level of
significance to lead you to believe that there is an association between cola preference and age?
Observed Sample of 800 People
Cola A
Cola B
Cola C
Total
15-29
94
102
105
301
30-44
99
97
86
282
45-59
68
73
76
217
Total
261
272
267
800
Expected Values
Cola A
Cola B
Cola C
Total
(301)(272)/800
(282)(272)/800
(217)(272)/800
272
15-29
301
(301)(261)/800
(282)(261)/800
(217)(261)/800
(301)(267)/800
(282)(267)/800
(217)(267)/800
30-44
282
45-59
217
Total
261
267
800
Expert Solution
This question has been solved!
Explore an expertly crafted, step-by-step solution for a thorough understanding of key concepts.

This is a popular solution!

Trending now
This is a popular solution!

Step by step
Solved in 3 steps with 6 images

Knowledge Booster


Learn more about
Need a deep-dive on the concept behind this application? Look no further. Learn more about this topic, statistics and related others by exploring similar questions and additional content below.Recommended textbooks for you
Holt Mcdougal Larson Pre-algebra: Student Edition…
Algebra
ISBN:
9780547587776
Author:
HOLT MCDOUGAL
Publisher:
HOLT MCDOUGAL

Glencoe Algebra 1, Student Edition, 9780079039897…
Algebra
ISBN:
9780079039897
Author:
Carter
Publisher:
McGraw Hill
Holt Mcdougal Larson Pre-algebra: Student Edition…
Algebra
ISBN:
9780547587776
Author:
HOLT MCDOUGAL
Publisher:
HOLT MCDOUGAL
Glencoe Algebra 1, Student Edition, 9780079039897…
Algebra
ISBN:
9780079039897
Author:
Carter
Publisher:
McGraw Hill