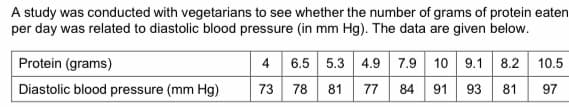
a) State the name of the graph that can be used to investigate the relationship between the number of grams of protein eaten per day and diastolic blood pressure (mm Hg). b) Calculate the Pearson's coefficient of correlation. Comment on the value obtained. c) Determine the simple linear regression equation using the least squares method.


a) State the name of the graph that can be used to investigate the relationship between the number of grams of protein eaten per day and diastolic blood pressure (mm Hg).
b) Calculate the Pearson's coefficient of
c) Determine the simple linear regression equation using the least squares method.
d) Interpret the value of the slope of the regression line obtained in (c).
e) Calculate the percentage of variation in diastolic blood pressure that is NOT explained by the variation in grams of protein eaten per day.
f) Estimate the average diastolic blood pressure given that the number of grams of protein ate per day is 8.5.

Step by step
Solved in 4 steps with 2 images

d) Interpret the value of the slope of the regression line obtained in (c).
e) Calculate the percentage of variation in diastolic blood pressure that is NOT explained by the variation in grams of protein eaten per day.
f) Estimate the average diastolic blood pressure given that the number of grams of protein ate per day is 8.5.


