(a) State the null hypothesis H, and the alternative hypothesis H,. H, :0 H, :0 (b) Determine the type of test statistic to use. (Choose one) ▼ (c) Find the value of the test statistic. (Round to three or more decimal places.) (d) Find the two critical values at the 0.05 level of significance. (Round to three or more decimal places.) I and (e) Can we conclude that the proportion of voters in Florida who plan to vote differs from the proportion of voters in New York who plan to vote?
(a) State the null hypothesis H, and the alternative hypothesis H,. H, :0 H, :0 (b) Determine the type of test statistic to use. (Choose one) ▼ (c) Find the value of the test statistic. (Round to three or more decimal places.) (d) Find the two critical values at the 0.05 level of significance. (Round to three or more decimal places.) I and (e) Can we conclude that the proportion of voters in Florida who plan to vote differs from the proportion of voters in New York who plan to vote?

Holt Mcdougal Larson Pre-algebra: Student Edition 2012
1st Edition
ISBN:9780547587776
Author:HOLT MCDOUGAL
Publisher:HOLT MCDOUGAL
Chapter11: Data Analysis And Probability
Section: Chapter Questions
Problem 8CR

Related questions
Question
Answer letter a,b,c,d, and e pls. on the second picture.
Transcribed Image Text:3.
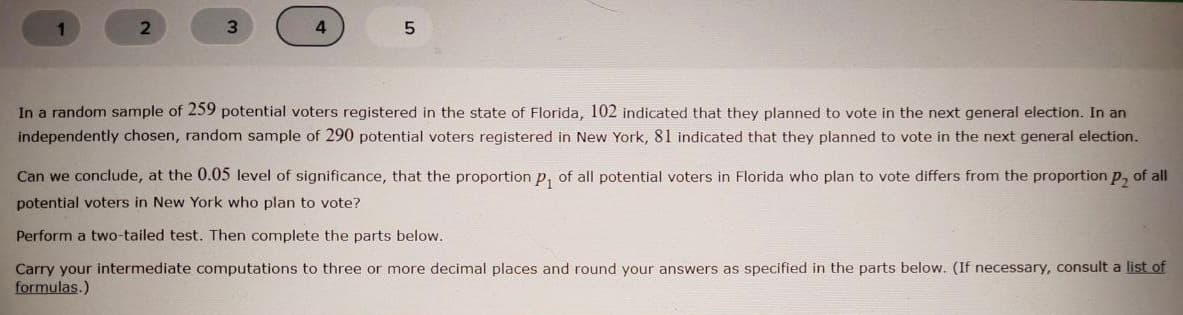
In a random sample of 259 potential voters registered in the state of Florida, 102 indicated that they planned to vote in the next general election. In an
independently chosen, random sample of 290 potential voters registered in New York, 81 indicated that they planned to vote in the next general election.
Can we conclude, at the 0.05 level of significance, that the proportion p, of all potential voters in Florida who plan to vote differs from the proportion p, of all
potential voters in New York who plan to vote?
Perform a two-tailed test. Then complete the parts below.
Carry your intermediate computations to three or more decimal places and round your answers as specified in the parts below. (If necessary, consult a list of
formulas.)
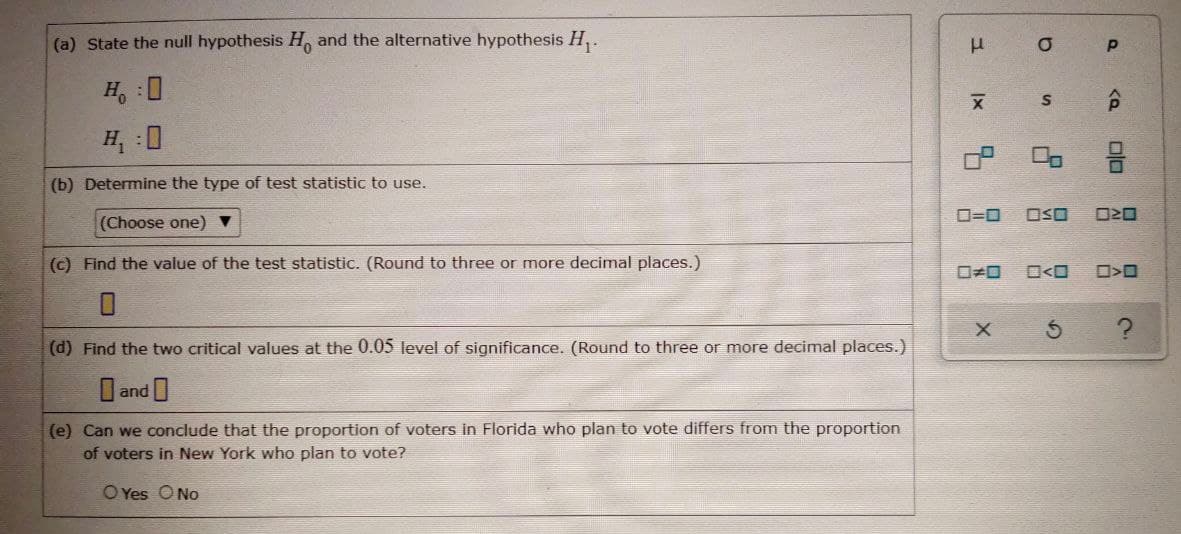
Transcribed Image Text:(a) State the null hypothesis H, and the alternative hypothesis H,.
H, :0
H :0
(b) Determine the type of test statistic to use.
O=0
OSO
(Choose one) ▼
(c) Find the value of the test statistic. (Round to three or more decimal places.)
O<O
(d) Find the two critical values at the 0.05 level of significance. (Round to three or more decimal places.)
I and
(e) Can we conclude that the proportion of voters in Florida who plan to vote differs from the proportion
of voters in New York who plan to vote?
O Yes ONo
olo
Expert Solution
This question has been solved!
Explore an expertly crafted, step-by-step solution for a thorough understanding of key concepts.

Step by step
Solved in 2 steps with 1 images

Recommended textbooks for you
Holt Mcdougal Larson Pre-algebra: Student Edition…
Algebra
ISBN:
9780547587776
Author:
HOLT MCDOUGAL
Publisher:
HOLT MCDOUGAL

College Algebra (MindTap Course List)
Algebra
ISBN:
9781305652231
Author:
R. David Gustafson, Jeff Hughes
Publisher:
Cengage Learning
Holt Mcdougal Larson Pre-algebra: Student Edition…
Algebra
ISBN:
9780547587776
Author:
HOLT MCDOUGAL
Publisher:
HOLT MCDOUGAL
College Algebra (MindTap Course List)
Algebra
ISBN:
9781305652231
Author:
R. David Gustafson, Jeff Hughes
Publisher:
Cengage Learning