(a) State the null hypothesis H, and the alternative hypothesis H.. Ho :0 H :0 (b) Determine the type of test statistic to use. (Choose one) ▼ O=0 OSO O20 (c) Find the value of the test statistic. (Round to three or more decimal places.) (d) Find the p-value. (Round to three or more decimal places.) ? (e) Can we conclude that the proportion of voters in Iowa who plan to vote differs from the proportion of voters in Tennessee who plan to vote? OYes ONo
(a) State the null hypothesis H, and the alternative hypothesis H.. Ho :0 H :0 (b) Determine the type of test statistic to use. (Choose one) ▼ O=0 OSO O20 (c) Find the value of the test statistic. (Round to three or more decimal places.) (d) Find the p-value. (Round to three or more decimal places.) ? (e) Can we conclude that the proportion of voters in Iowa who plan to vote differs from the proportion of voters in Tennessee who plan to vote? OYes ONo

Holt Mcdougal Larson Pre-algebra: Student Edition 2012
1st Edition
ISBN:9780547587776
Author:HOLT MCDOUGAL
Publisher:HOLT MCDOUGAL
Chapter11: Data Analysis And Probability
Section: Chapter Questions
Problem 8CR

Related questions
Question
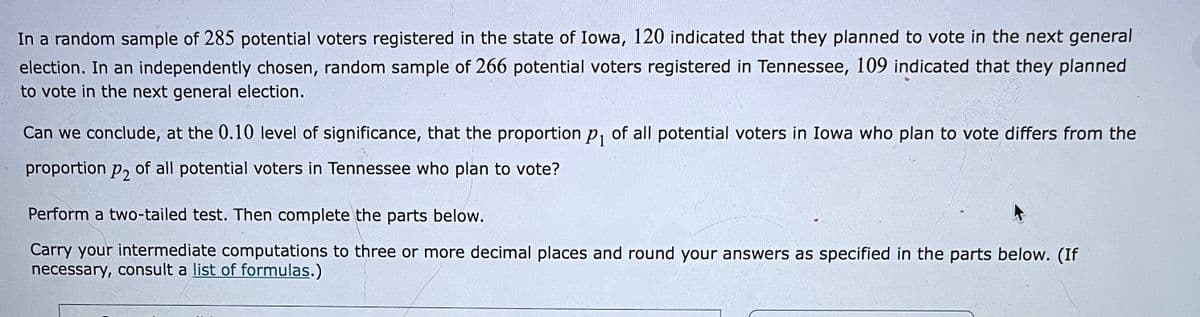
Transcribed Image Text:In a random sample of 285 potential voters registered in the state of Iowa, 120 indicated that they planned to vote in the next general
election. In an independently chosen, random sample of 266 potential voters registered in Tennessee, 109 indicated that they planned
to vote in the next general election.
Can we conclude, at the 0.10 level of significance, that the proportion p, of all potential voters in Iowa who plan to vote differs from the
proportion P2
of all potential voters in Tennessee who plan to vote?
Perform a two-tailed test. Then complete the parts below.
Carry your intermediate computations to three or more decimal places and round your answers as specified in the parts below. (If
necessary, consult a list of formulas.)
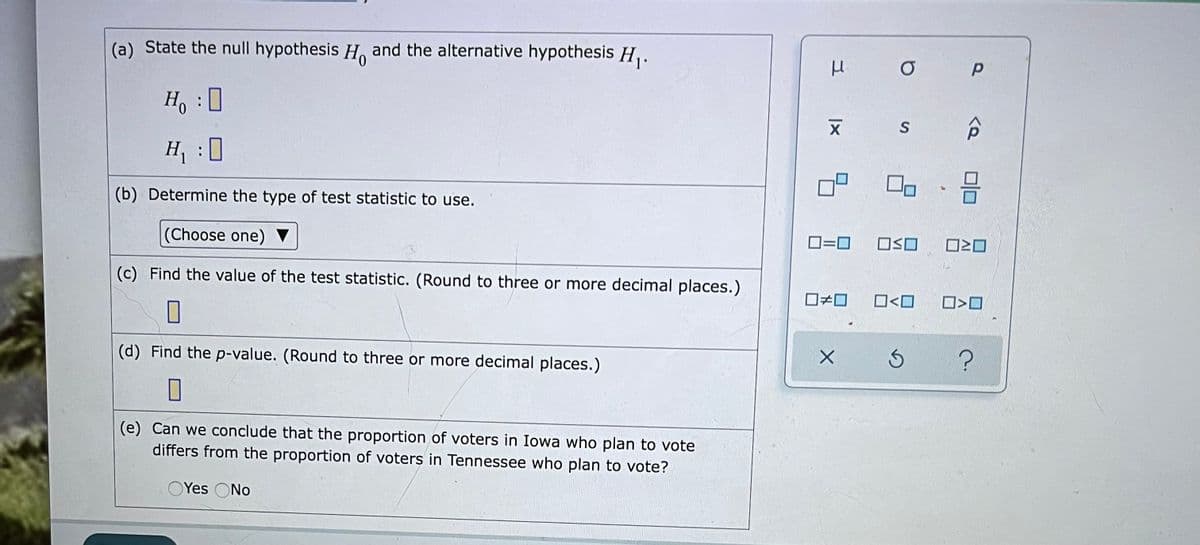
Transcribed Image Text:(a) State the null hypothesis H. and the alternative hypothesis H,.
Ho
S
H :
0
(b) Determine the type of test statistic to use.
(Choose one) ▼
O=0
ロSロ
(c) Find the value of the test statistic. (Round to three or more decimal places.)
O<O
(d) Find the p-value. (Round to three or more decimal places.)
(e) Can we conclude that the proportion of voters in Iowa who plan to vote
differs from the proportion of voters in Tennessee who plan to vote?
OYes ONo
Expert Solution
This question has been solved!
Explore an expertly crafted, step-by-step solution for a thorough understanding of key concepts.

Step by step
Solved in 3 steps with 3 images

Recommended textbooks for you
Holt Mcdougal Larson Pre-algebra: Student Edition…
Algebra
ISBN:
9780547587776
Author:
HOLT MCDOUGAL
Publisher:
HOLT MCDOUGAL
Holt Mcdougal Larson Pre-algebra: Student Edition…
Algebra
ISBN:
9780547587776
Author:
HOLT MCDOUGAL
Publisher:
HOLT MCDOUGAL