A tutorial school has been running IELTS mock examination for many years. Below is the summary presented by the tutorial school related to the IELTS mock examination in one of the many online classes selected randomly in year 2022. IELTS score in mock examination, Number of students <4 5 5 15 8 10 9. 3 A report presented by this tutorial school 5 years ago indicated that the population mean score of IELTS mock examination was 7.05 points and the population proportion of students got 7 points or above was 0.67. (a) Construct a 95% confidence interval estimate of population mean score a student get in the IELTS mock examination in 2022. (b) Test, at 1% level of significance, if the population proportion of students get 7 points or above in 2022 is higher than that in year 2017. (The report must include the (i) null hypothesis and alternative hypothesis, (ii) rejection region(s), (iii) calculation of test statistics, and (iv) conclusion.) (c) If the confidence interval estimate in part (a) is constructed at 99% instead of 95%, would the interval be (1) wider, (II) narrower, or (III) no change in width? (State your answer, no explanation is needed in part (c).)
A tutorial school has been running IELTS mock examination for many years. Below is the summary presented by the tutorial school related to the IELTS mock examination in one of the many online classes selected randomly in year 2022. IELTS score in mock examination, Number of students <4 5 5 15 8 10 9. 3 A report presented by this tutorial school 5 years ago indicated that the population mean score of IELTS mock examination was 7.05 points and the population proportion of students got 7 points or above was 0.67. (a) Construct a 95% confidence interval estimate of population mean score a student get in the IELTS mock examination in 2022. (b) Test, at 1% level of significance, if the population proportion of students get 7 points or above in 2022 is higher than that in year 2017. (The report must include the (i) null hypothesis and alternative hypothesis, (ii) rejection region(s), (iii) calculation of test statistics, and (iv) conclusion.) (c) If the confidence interval estimate in part (a) is constructed at 99% instead of 95%, would the interval be (1) wider, (II) narrower, or (III) no change in width? (State your answer, no explanation is needed in part (c).)

Glencoe Algebra 1, Student Edition, 9780079039897, 0079039898, 2018
18th Edition
ISBN:9780079039897
Author:Carter
Publisher:Carter
Chapter10: Statistics
Section10.6: Summarizing Categorical Data
Problem 10CYU

Related questions
Question
100%
Transcribed Image Text:Text Rewriter an...
|Introducing Vide..
Iwww.ljern.com/..
PKP View of Podc
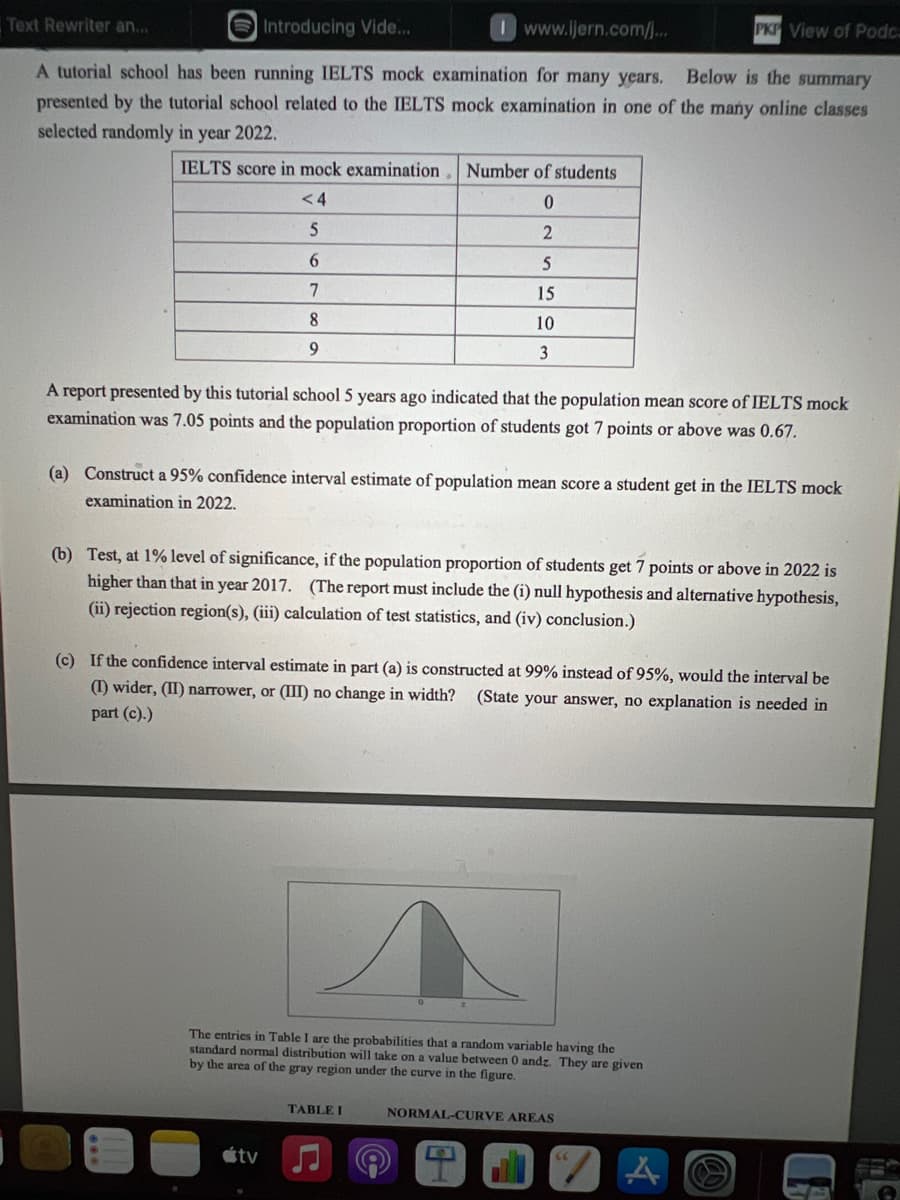
A tutorial school has been running IELTS mock examination for many years.
Below is the summary
presented by the tutorial school related to the IELTS mock examination in one of the many online classes
selected randomly in year 2022.
IELTS score in mock examination
Number of students
<4
2
6.
5
15
8.
10
3
A report presented by this tutorial school 5 years ago indicated that the population mean score of IELTS mock
examination was 7.05 points and the population proportion of students got 7 points or above was 0.67.
(a) Construct a 95% confidence interval estimate of population mean score a student get in the IELTS mock
examination in 2022.
(b) Test, at 1% level of significance, if the population proportion of students get 7 points or above in 2022 is
higher than that in year 2017. (The report must include the (i) null hypothesis and alternative hypothesis,
(ii) rejection region(s), (iii) calculation of test statistics, and (iv) conclusion.)
(c) If the confidence interval estimate in part (a) is constructed at 99% instead of 95%, would the interval be
(1) wider, (II) narrower, or (III) no change in width? (State your answer, no explanation is needed in
part (c).)
The entries in Table I are the probabilities that a random variable having the
standard normal distribution will take on a value between 0 andz. They are given
by the area of the gray region under the curve in the figure.
TABLE I
NORMAL-CURVE AREAS
田
étv
Expert Solution
This question has been solved!
Explore an expertly crafted, step-by-step solution for a thorough understanding of key concepts.

Step by step
Solved in 3 steps with 3 images

Recommended textbooks for you
Glencoe Algebra 1, Student Edition, 9780079039897…
Algebra
ISBN:
9780079039897
Author:
Carter
Publisher:
McGraw Hill

Holt Mcdougal Larson Pre-algebra: Student Edition…
Algebra
ISBN:
9780547587776
Author:
HOLT MCDOUGAL
Publisher:
HOLT MCDOUGAL

Glencoe Algebra 1, Student Edition, 9780079039897…
Algebra
ISBN:
9780079039897
Author:
Carter
Publisher:
McGraw Hill
Holt Mcdougal Larson Pre-algebra: Student Edition…
Algebra
ISBN:
9780547587776
Author:
HOLT MCDOUGAL
Publisher:
HOLT MCDOUGAL

College Algebra (MindTap Course List)
Algebra
ISBN:
9781305652231
Author:
R. David Gustafson, Jeff Hughes
Publisher:
Cengage Learning