(a) State the null hypothesis H, and the alternative hypothesis H1. Ho :0 H :0 (b) Determine the type of test statistic to use. |(Choose one) O=0 OSO O20 (c) Find the value of the test statistic. (Round to three or more decimal places.) O
(a) State the null hypothesis H, and the alternative hypothesis H1. Ho :0 H :0 (b) Determine the type of test statistic to use. |(Choose one) O=0 OSO O20 (c) Find the value of the test statistic. (Round to three or more decimal places.) O

College Algebra (MindTap Course List)
12th Edition
ISBN:9781305652231
Author:R. David Gustafson, Jeff Hughes
Publisher:R. David Gustafson, Jeff Hughes
Chapter8: Sequences, Series, And Probability
Section8.7: Probability
Problem 58E: What is meant by the sample space of an experiment?

Related questions
Question
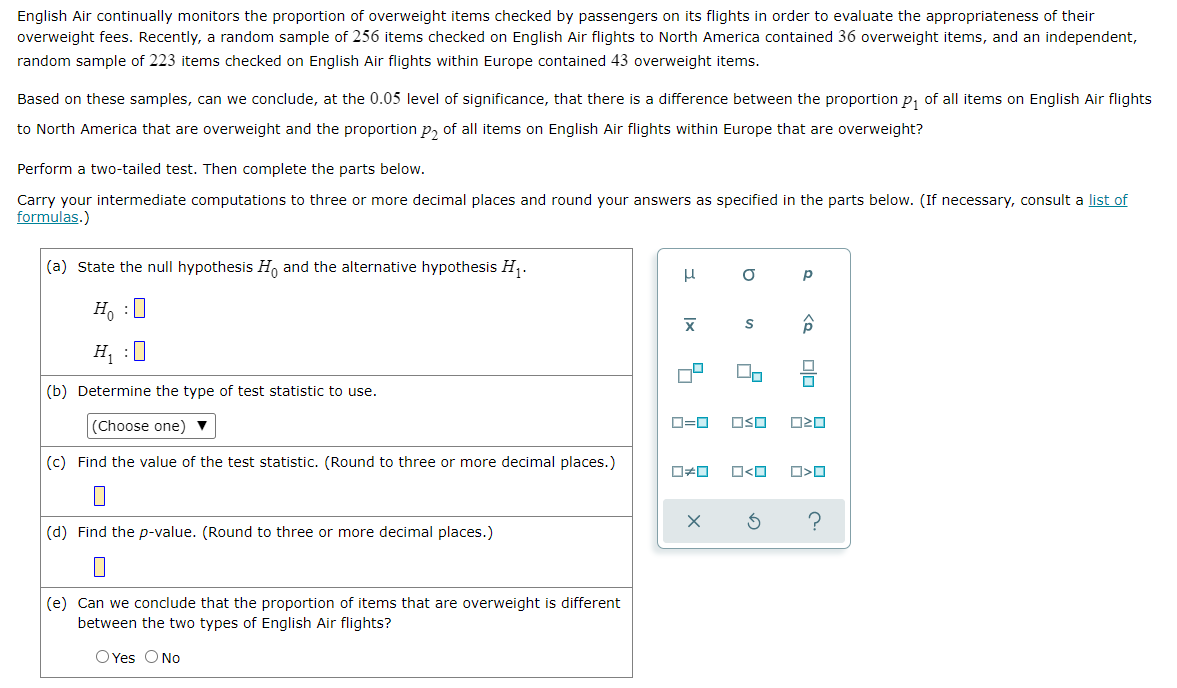
Transcribed Image Text:English Air continually monitors the proportion of overweight items checked by passengers on its flights in order to evaluate the appropriateness of their
overweight fees. Recently, a random sample of 256 items checked on English Air flights to North America contained 36 overweight items, and an independent,
random sample of 223 items checked on English Air flights within Europe contained 43 overweight items.
Based on these samples, can we conclude, at the 0.05 level of significance, that there is a difference between the proportion p, of all items on English Air flights
to North America that are overweight and the proportion p, of all items on English Air flights within Europe that are overweight?
Perform a two-tailed test. Then complete the parts below.
Carry your intermediate computations to three or more decimal places and round your answers as specified in the parts below. (If necessary, consult a list of
formulas.)
(a) State the null hypothesis H and the alternative hypothesis H,.
H, :0
H :0
On
(b) Determine the type of test statistic to use.
(Choose one) ▼
D=0
OSO
(c) Find the value of the
statistic. (Round to three or mor
decimal places.)
(d) Find the p-value. (Round to three or more decimal places.)
(e) Can we conclude that the proportion of items that are overweight is different
between the two types of English Air flights?
OYes ONo
Expert Solution
This question has been solved!
Explore an expertly crafted, step-by-step solution for a thorough understanding of key concepts.

Step by step
Solved in 2 steps

Recommended textbooks for you
College Algebra (MindTap Course List)
Algebra
ISBN:
9781305652231
Author:
R. David Gustafson, Jeff Hughes
Publisher:
Cengage Learning
College Algebra (MindTap Course List)
Algebra
ISBN:
9781305652231
Author:
R. David Gustafson, Jeff Hughes
Publisher:
Cengage Learning