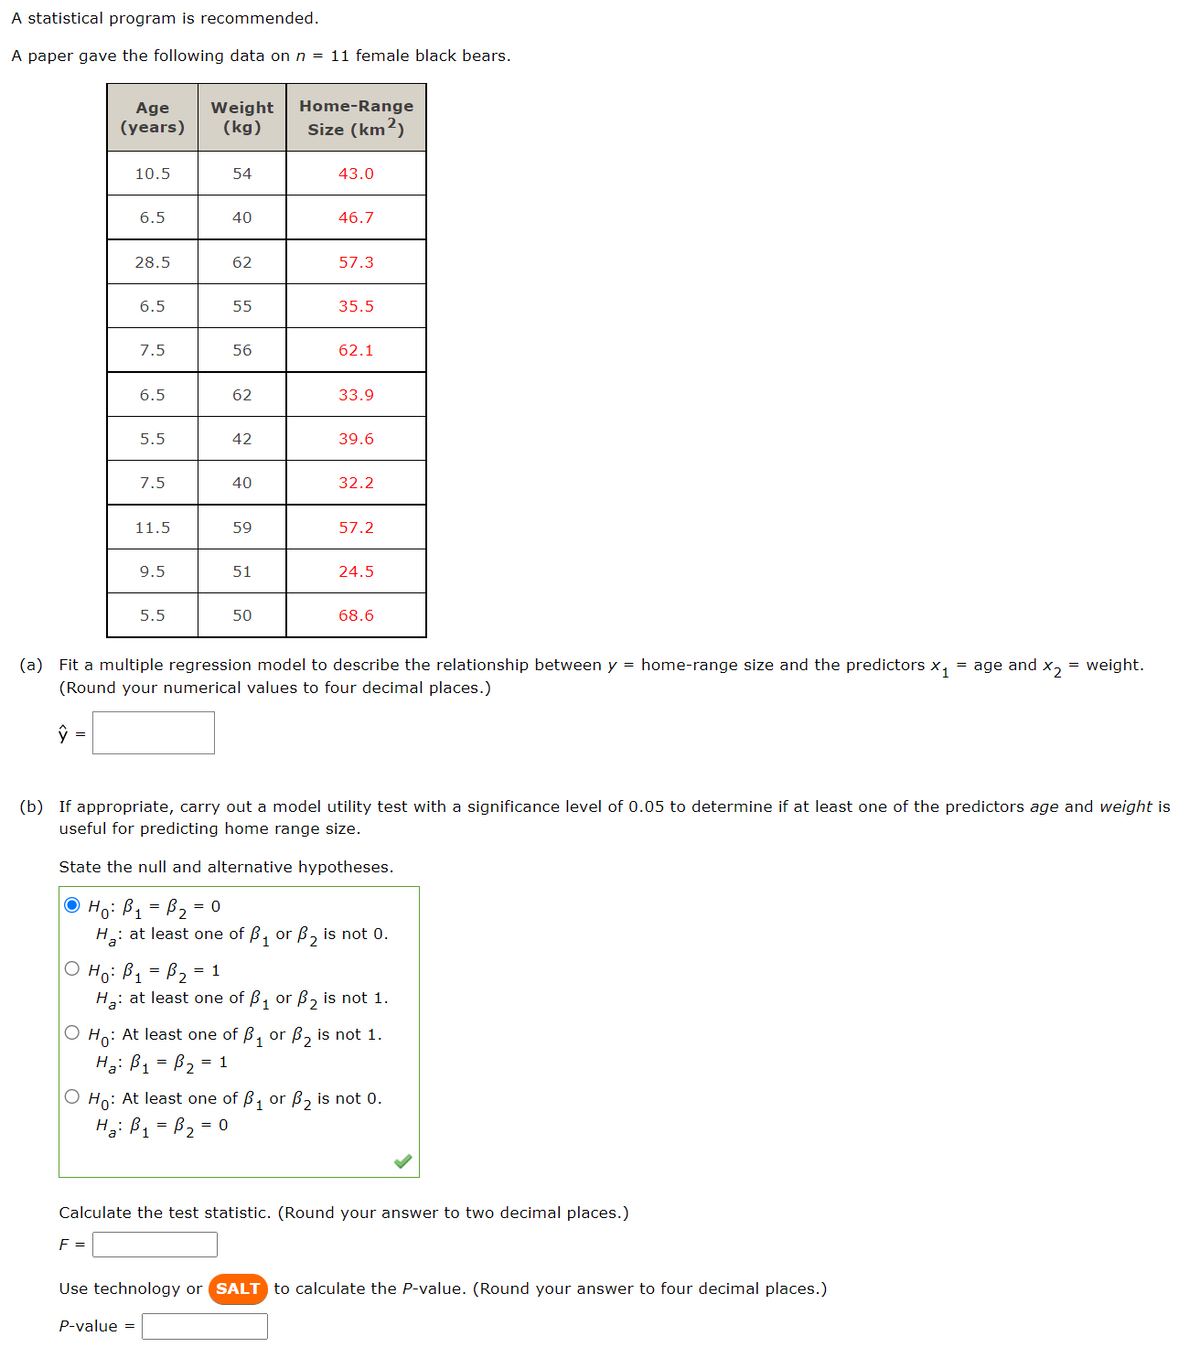
A statistical program is recommended. A paper gave the following data on n = 11 female black bears. Age Weight (years) (kg) 10.5 6.5 28.5 6.5 7.5 6.5 5.5 7.5 11.5 9.5 5.5 54 40 62 55 56 62 42 40 59 51 50 Home-Range Size (km²) 43.0 46.7 57.3 35.5 62.1 33.9 39.6 32.2 57.2 24.5 68.6 (a) Fit a multiple regression model to describe the relationship between y = home-range size and the predictors x₁ = age and x₂ = weight. (Round your numerical values to four decimal places.) ŷ = (b) If appropriate, carry out a model utility test with a significance level of 0.05 to determine if at least one of the predictors age and weight is useful for predicting home range size. State the null and alternative hypotheses. Ho: B₁ = B₂₁ = 0 H₂: at least one of ₁ or B₂ is not 0. Ho: B₁ =B₂ = 1 H₂: at least one of B₁ or B₂ is not 1. O Ho: At least one of ₁ or ₂ is not 1. Ha: B₁ = B₂ = 1 O Ho: At least one of B₁ or B₂ is not 0. на: В1 B₂ = 0 Calculate the test statistic. (Round your answer to two decimal places.) F = Use technology or SALT to calculate the P-value. (Round your answer to four decimal places.) P-value =
A statistical program is recommended. A paper gave the following data on n = 11 female black bears. Age Weight (years) (kg) 10.5 6.5 28.5 6.5 7.5 6.5 5.5 7.5 11.5 9.5 5.5 54 40 62 55 56 62 42 40 59 51 50 Home-Range Size (km²) 43.0 46.7 57.3 35.5 62.1 33.9 39.6 32.2 57.2 24.5 68.6 (a) Fit a multiple regression model to describe the relationship between y = home-range size and the predictors x₁ = age and x₂ = weight. (Round your numerical values to four decimal places.) ŷ = (b) If appropriate, carry out a model utility test with a significance level of 0.05 to determine if at least one of the predictors age and weight is useful for predicting home range size. State the null and alternative hypotheses. Ho: B₁ = B₂₁ = 0 H₂: at least one of ₁ or B₂ is not 0. Ho: B₁ =B₂ = 1 H₂: at least one of B₁ or B₂ is not 1. O Ho: At least one of ₁ or ₂ is not 1. Ha: B₁ = B₂ = 1 O Ho: At least one of B₁ or B₂ is not 0. на: В1 B₂ = 0 Calculate the test statistic. (Round your answer to two decimal places.) F = Use technology or SALT to calculate the P-value. (Round your answer to four decimal places.) P-value =

Holt Mcdougal Larson Pre-algebra: Student Edition 2012
1st Edition
ISBN:9780547587776
Author:HOLT MCDOUGAL
Publisher:HOLT MCDOUGAL
Chapter11: Data Analysis And Probability
Section: Chapter Questions
Problem 8CR

Related questions
Question
Transcribed Image Text:A statistical program is recommended.
A paper gave the following data on n = 11 female black bears.
Age Weight
(years) (kg)
10.5
6.5
28.5
F =
6.5
7.5
6.5
5.5
7.5
11.5
P-value =
9.5
5.5
54
|O Ho: B1 = B2 =1
40
62
55
56
62
42
40
59
51
50
H₂: at least one of B₁
or
H₂: at least one of B₁ or
Home-Range
Size (km²)
Ho: At least one of ₁ or
H₂: B₁ = B₂ = 1
43.0
46.7
57.3
35.5
62.1
= weight.
(a) Fit a multiple regression model to describe the relationship between y = home-range size and the predictors X₁ = age and X2
(Round your numerical values to four decimal places.)
ŷ
33.9
(b) If appropriate, carry out a model utility test with a significance level of 0.05 to determine if at least one of the predictors age and weight is
useful for predicting home range size.
State the null and alternative hypotheses.
ⒸH₁: B₁ = B₂ = 0
39.6
32.2
57.2
24.5
68.6
B₂ is not 0.
₂ is not 1.
O Ho: At least one of ₁ or ₂ is not 0.
H₂: B₁ = B₂ = 0
₂ is not 1.
Calculate the test statistic. (Round your answer to two decimal places.)
Use technology or SALT to calculate the P-value. (Round your answer to four decimal places.)
Expert Solution
This question has been solved!
Explore an expertly crafted, step-by-step solution for a thorough understanding of key concepts.

Step by step
Solved in 3 steps with 2 images

Recommended textbooks for you
Holt Mcdougal Larson Pre-algebra: Student Edition…
Algebra
ISBN:
9780547587776
Author:
HOLT MCDOUGAL
Publisher:
HOLT MCDOUGAL
Holt Mcdougal Larson Pre-algebra: Student Edition…
Algebra
ISBN:
9780547587776
Author:
HOLT MCDOUGAL
Publisher:
HOLT MCDOUGAL