A statistical program is recommended. Spring is a peak time for selling houses. Suppose the data below contains the selling price, number of bathrooms, square footage, and number of bedrooms of 26 homes sold in Ft. Thomas, Kentucky, in spring 2018. Selling Price 295,000 Selling Price Baths Sq Ft 1.5 1,786 2 1,768 160,000 170,000 176,000 182,500 195,100 212,500 245,900 250,000 1 1,219 1 1 1,578 1.5 1,125 2 1,196 2 2,128 3 1,280 255,000 258,000 267,000 2.5 2,439 2 1,470 266,000 275,000 2 1,596 2,374 2.5 2 1,668 Beds 3 3 3 2 3 2 3 3 3 4 3 4 325,000 325,000 328,400 331,000 344,500 365,000 385,000 395,000 399,000 430,000 430,000 454,000 Baths Sq Ft Beds 2.5 1,860 3 2,056 3.5 2,776 2 1,408 1.5 1,972 2.5 1,736 1,990 2.5 2.5 3,640 1,908 2 2,108 2.5 2 2,462 2 2,615 3.5 3,700 3 4 4 3 4 4 4 3 4 4 4 Consider the estimated regression equation we developed that can be used to predict the selling price given the number of bathrooms, square footage, and number of bedrooms in the house. (x, denotes number of bathrooms, x₂ denotes square footage x denotes number of bedrooms, and y denotes the selling price.) -12166.49 +13738.77x, + 54.15x₂ + 50555.14xy (a) Does the estimated regression equation provide a good fit to the data? Explain. (Round your answer to two decimal places.) Since the adjusted R2-1 , the estimated regression equation provides ✔ a good fit. (b) Consider the estimated regression equation that was developed which predicts selling price given the square footage and number of bedrooms. (x₂ denotes square footage, x, denotes number of bedrooms, and y denotes the selling price.) -6419.88 +59.45x, +54635.27% Compare the fit for this simpler model to that of the model that also includes number of bathrooms as an independent variable. (Round your answer to two decimal places.) The adjusted R2 for the simpler model is , which is larger ✔than the adjusted R2 in part (a). The model from part b✔ is preferred.
A statistical program is recommended. Spring is a peak time for selling houses. Suppose the data below contains the selling price, number of bathrooms, square footage, and number of bedrooms of 26 homes sold in Ft. Thomas, Kentucky, in spring 2018. Selling Price 295,000 Selling Price Baths Sq Ft 1.5 1,786 2 1,768 160,000 170,000 176,000 182,500 195,100 212,500 245,900 250,000 1 1,219 1 1 1,578 1.5 1,125 2 1,196 2 2,128 3 1,280 255,000 258,000 267,000 2.5 2,439 2 1,470 266,000 275,000 2 1,596 2,374 2.5 2 1,668 Beds 3 3 3 2 3 2 3 3 3 4 3 4 325,000 325,000 328,400 331,000 344,500 365,000 385,000 395,000 399,000 430,000 430,000 454,000 Baths Sq Ft Beds 2.5 1,860 3 2,056 3.5 2,776 2 1,408 1.5 1,972 2.5 1,736 1,990 2.5 2.5 3,640 1,908 2 2,108 2.5 2 2,462 2 2,615 3.5 3,700 3 4 4 3 4 4 4 3 4 4 4 Consider the estimated regression equation we developed that can be used to predict the selling price given the number of bathrooms, square footage, and number of bedrooms in the house. (x, denotes number of bathrooms, x₂ denotes square footage x denotes number of bedrooms, and y denotes the selling price.) -12166.49 +13738.77x, + 54.15x₂ + 50555.14xy (a) Does the estimated regression equation provide a good fit to the data? Explain. (Round your answer to two decimal places.) Since the adjusted R2-1 , the estimated regression equation provides ✔ a good fit. (b) Consider the estimated regression equation that was developed which predicts selling price given the square footage and number of bedrooms. (x₂ denotes square footage, x, denotes number of bedrooms, and y denotes the selling price.) -6419.88 +59.45x, +54635.27% Compare the fit for this simpler model to that of the model that also includes number of bathrooms as an independent variable. (Round your answer to two decimal places.) The adjusted R2 for the simpler model is , which is larger ✔than the adjusted R2 in part (a). The model from part b✔ is preferred.

Glencoe Algebra 1, Student Edition, 9780079039897, 0079039898, 2018
18th Edition
ISBN:9780079039897
Author:Carter
Publisher:Carter
Chapter10: Statistics
Section10.6: Summarizing Categorical Data
Problem 4AGP

Related questions
Question
J 1
Transcribed Image Text:A statistical program is recommended.
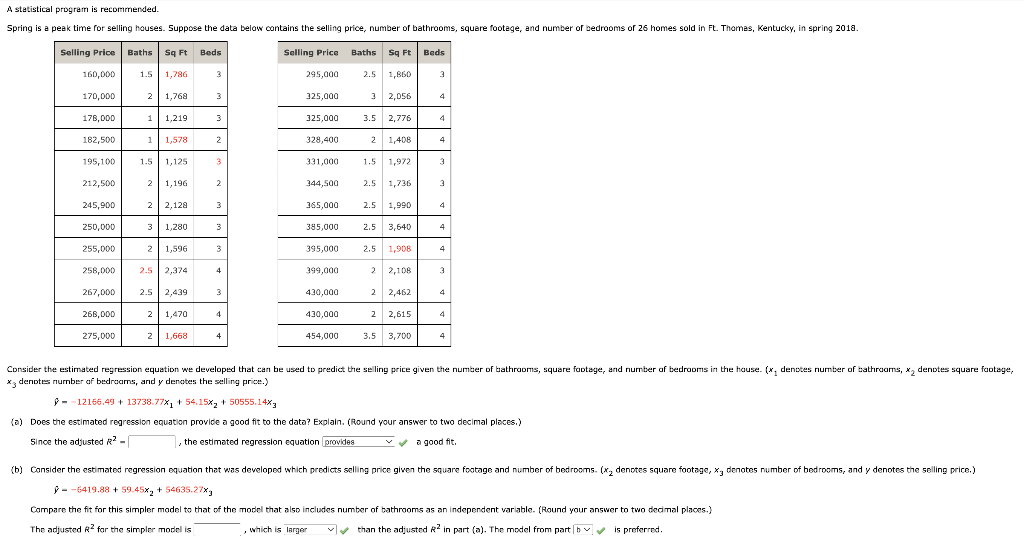
Spring is a peak time for selling houses. Suppose the data below contains the selling price, number of bathrooms, square footage, and number of bedrooms of 26 homes sold in Ft. Thomas, Kentucky, in spring 2018.
Selling Price Baths Sq Ft
1.5 1,786
160,000
170,000
2 1,768
178,000
1 1,219
182,500
1 1,578
195,100 1.5 1,125
212,500
2 1,196
245,900
2 2,128
3 1,280
2 1,596
250,000
255,000
258,000
267,000
268,000
275,000
2.5 2,374
2.5 2,439
2 1,470
2 1,668
Beds
3
3
3
2
3
2
3
3
3
4
3
4
4
Selling Price
295,000
325,000
325,000
328,400
Baths Sq Ft
454,000
2.5 1,860
2,056
3.5 2,776
2 1,408
331,000
344,500
365,000
385,000
395,000 2.5
399,000
430,000
430,000
3
,
the estimated regression equation provides
1.5
2.5 1,736
1,972
2.5 1,990
2.5 3,640
1,908
2,108
2,462
2
2
2 2,615
3.5 3,700
Beds
3
4
4
4
3
3
4
4
4
3
4
4
4
Consider the estimated regression equation we developed that can be used to predict the selling price given the number of bathrooms, square footage, and number of bedrooms in the house. (x, denotes number of bathrooms, x₂ denotes square footage,
x denotes number of bedrooms, and y denotes the selling price.)
-12166.49 + 13738.77x₁ + 54.15x₂ +50555.14xy
(a) Does the estimated regression equation provide a good fit to the data? Explain. (Round your answer to two decimal places.)
Since the adjusted R2-
a good fit.
(b) Consider the estimated regression equation that was developed which predicts selling price given the square footage and number of bedrooms. (x₂ denotes square footage, x, denotes number of bedrooms, and y denotes the selling price.)
-6419.88 +59.45x₂ +54635.27%
Compare the fit for this simpler model to that of the model that also includes number of bathrooms as an independent variable. (Round your answer to two decimal places.)
The adjusted R2 for the simpler model is
, which is larger
than the adjusted R2 in part (a). The model from part b✔✔ is preferred.
Expert Solution
This question has been solved!
Explore an expertly crafted, step-by-step solution for a thorough understanding of key concepts.

This is a popular solution!

Trending now
This is a popular solution!

Step by step
Solved in 2 steps with 2 images

Recommended textbooks for you
Glencoe Algebra 1, Student Edition, 9780079039897…
Algebra
ISBN:
9780079039897
Author:
Carter
Publisher:
McGraw Hill
Glencoe Algebra 1, Student Edition, 9780079039897…
Algebra
ISBN:
9780079039897
Author:
Carter
Publisher:
McGraw Hill