A hypothetical distribution for a population of test scores is displayed below. The population has a mean of 60.4, a median of 62.8, and a standard deviation of 6.404. Each of the other four graphs labeled A to D represents possible distributions of sample means for random samples drawn from the population. What do you expect for the shape of the sampling distribution (the distribution of sample means for all possible samples of size n = 100)? POPULATION FELAN
A hypothetical distribution for a population of test scores is displayed below. The population has a mean of 60.4, a median of 62.8, and a standard deviation of 6.404. Each of the other four graphs labeled A to D represents possible distributions of sample means for random samples drawn from the population. What do you expect for the shape of the sampling distribution (the distribution of sample means for all possible samples of size n = 100)? POPULATION FELAN

Glencoe Algebra 1, Student Edition, 9780079039897, 0079039898, 2018
18th Edition
ISBN:9780079039897
Author:Carter
Publisher:Carter
Chapter10: Statistics
Section10.4: Distributions Of Data
Problem 19PFA

Related questions
Question
Transcribed Image Text:LAK
1
5
T
THE
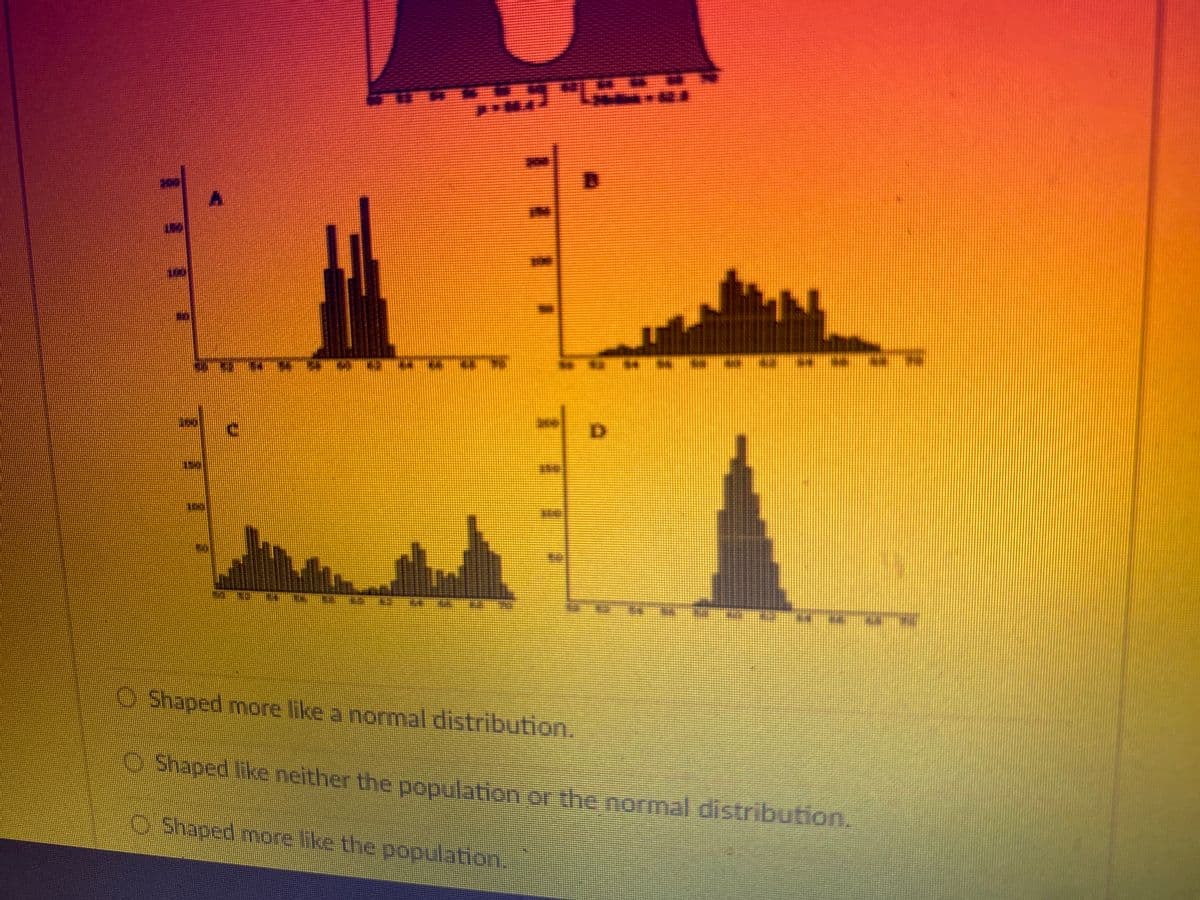
Shaped more like a normal distribution.
ⒸShaped like neither the population or the normal distribution.
Shaped more like the population.
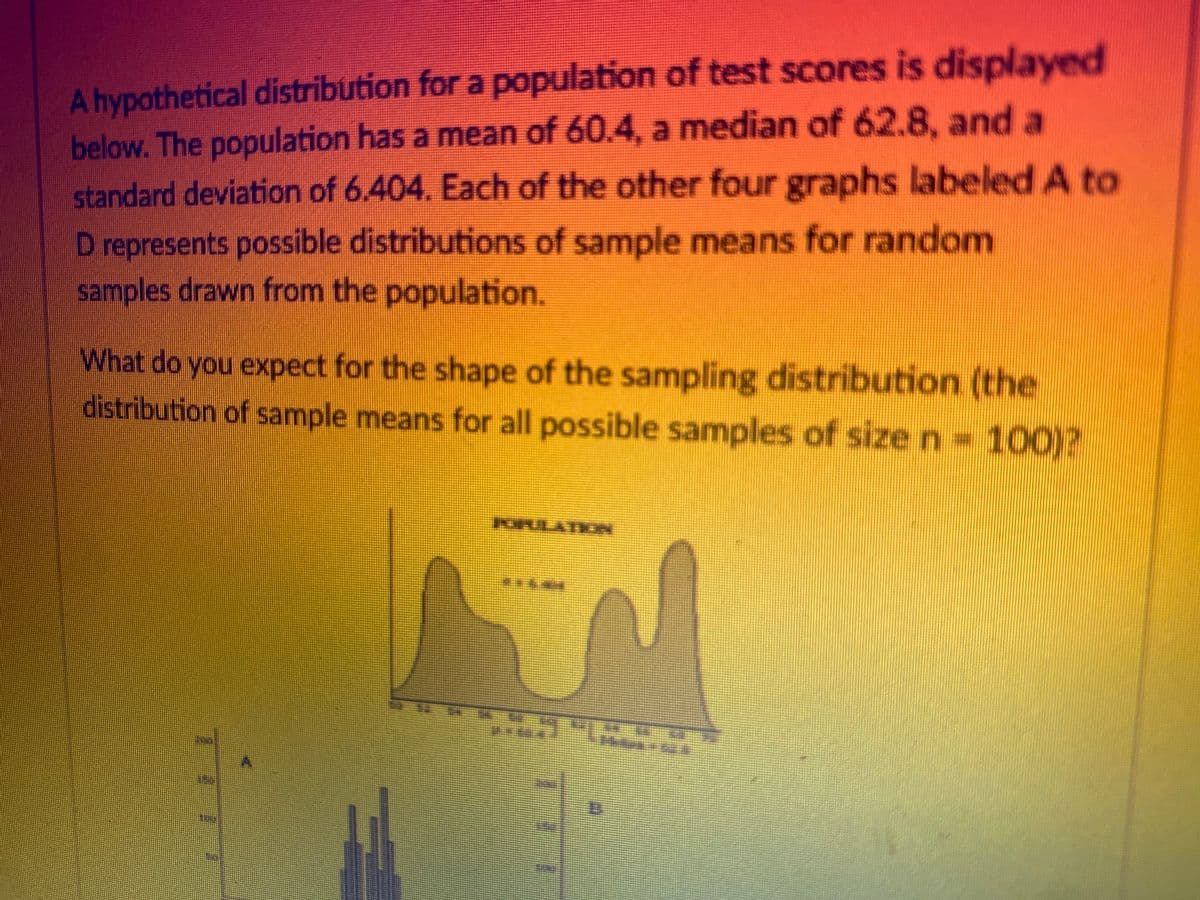
Transcribed Image Text:A hypothetical distribution for a population of test scores is displayed
below. The population has a mean of 60.4, a median of 62.8, and a
standard deviation of 6.404. Each of the other four graphs labeled A to
D represents possible distributions of sample means for random
samples drawn from the population.
What do you expect for the shape of the sampling distribution (the
distribution of sample means for all possible samples of size n = 100)?
POULATOA
S
DZI
Expert Solution
This question has been solved!
Explore an expertly crafted, step-by-step solution for a thorough understanding of key concepts.

This is a popular solution!

Trending now
This is a popular solution!

Step by step
Solved in 2 steps

Recommended textbooks for you
Glencoe Algebra 1, Student Edition, 9780079039897…
Algebra
ISBN:
9780079039897
Author:
Carter
Publisher:
McGraw Hill
Glencoe Algebra 1, Student Edition, 9780079039897…
Algebra
ISBN:
9780079039897
Author:
Carter
Publisher:
McGraw Hill