A statistical program is recommended. The authors of an article found that the speed of a prey (twips/s) and the length of a prey (twips x 100) are good predictors of the time (seconds) required to catch the prey. (A twip is a measure of distance used by programmers.) Data were collected in an experiment in which subjects were asked to "catch" an animal of prey moving across his or her computer screen by clicking on it with the mouse. The investigators varied the length of the prey and the speed with which the prey moved across the screen. The following data are consistent with summary values and a graph given in the article. Each value represents the average catch time over all subjects. The order of the various speed-length combinations was randomized for each subject. Prey Length Prey Speed 7 = 6 5 4 3 3 4 6 7 7 6 5 7 6 7 5 3 6 3 20 20 S 20 20 20 40 40 40 40 80 60 80 100 100 120 80 80 100 120 Catch Time 1.09 1.21 1.24 1.40 1.50 1.41 1.36 1.29 1.28 1.39 1.37 1.41 1.44 1.43 1.71 1.50 1.40 1.50 (a) Fit a multiple regression model for predicting catch time using prey length and speed as predictors. (Use x₁ for prey length and X₂ for speed. Round your numerical values to three decimal places.) 1.89 (b) Predict the catch time for an animal of prey whose length is 6 and whose speed is 50. (Round your answer to three decimal places.)
A statistical program is recommended. The authors of an article found that the speed of a prey (twips/s) and the length of a prey (twips x 100) are good predictors of the time (seconds) required to catch the prey. (A twip is a measure of distance used by programmers.) Data were collected in an experiment in which subjects were asked to "catch" an animal of prey moving across his or her computer screen by clicking on it with the mouse. The investigators varied the length of the prey and the speed with which the prey moved across the screen. The following data are consistent with summary values and a graph given in the article. Each value represents the average catch time over all subjects. The order of the various speed-length combinations was randomized for each subject. Prey Length Prey Speed 7 = 6 5 4 3 3 4 6 7 7 6 5 7 6 7 5 3 6 3 20 20 S 20 20 20 40 40 40 40 80 60 80 100 100 120 80 80 100 120 Catch Time 1.09 1.21 1.24 1.40 1.50 1.41 1.36 1.29 1.28 1.39 1.37 1.41 1.44 1.43 1.71 1.50 1.40 1.50 (a) Fit a multiple regression model for predicting catch time using prey length and speed as predictors. (Use x₁ for prey length and X₂ for speed. Round your numerical values to three decimal places.) 1.89 (b) Predict the catch time for an animal of prey whose length is 6 and whose speed is 50. (Round your answer to three decimal places.)

Glencoe Algebra 1, Student Edition, 9780079039897, 0079039898, 2018
18th Edition
ISBN:9780079039897
Author:Carter
Publisher:Carter
Chapter4: Equations Of Linear Functions
Section4.5: Correlation And Causation
Problem 2CYU

Related questions
Question
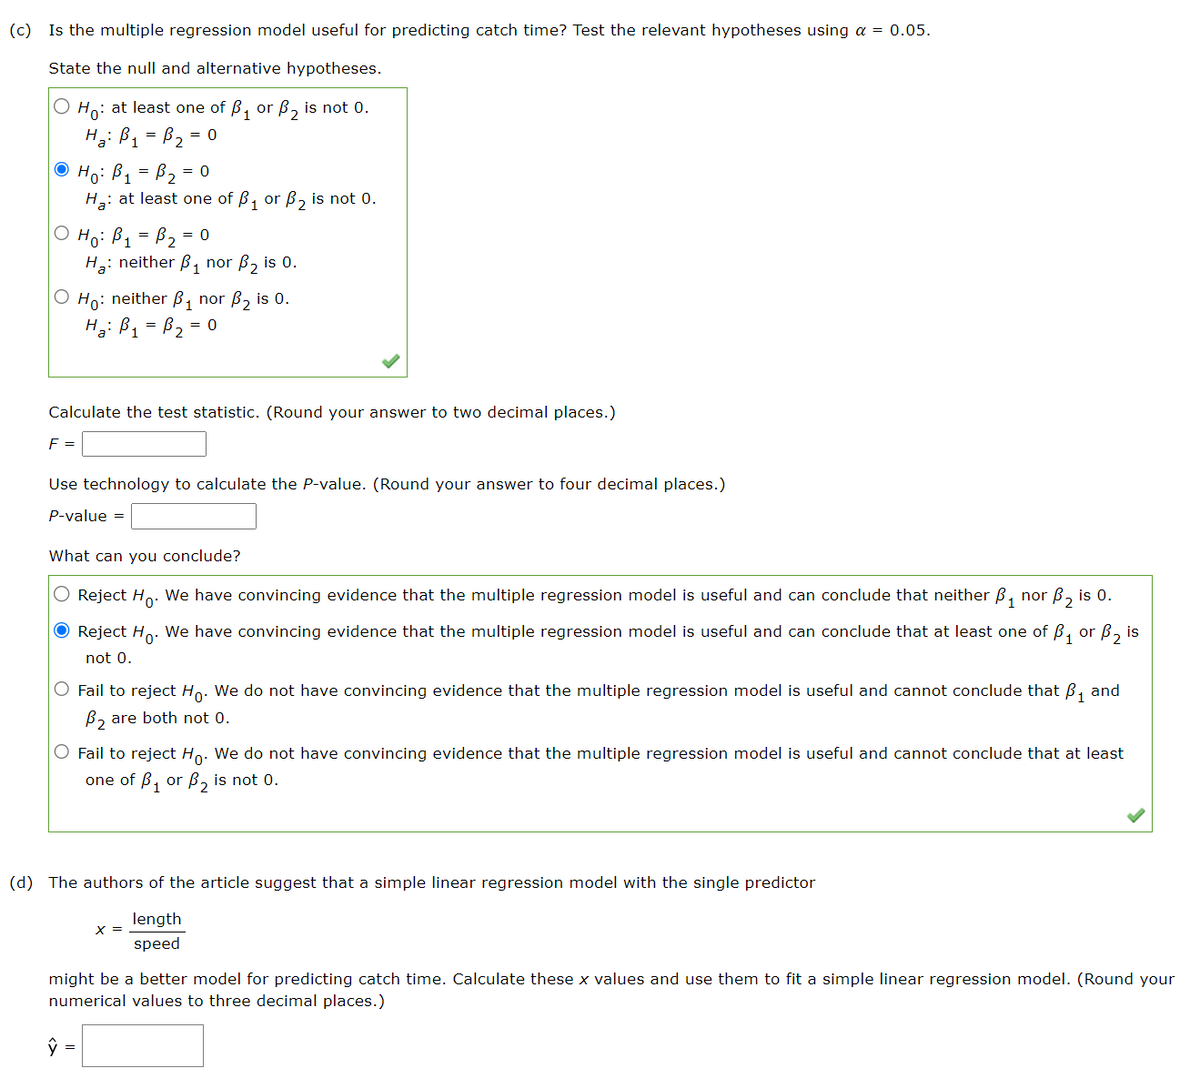
Transcribed Image Text:(c) Is the multiple regression model useful for predicting catch time? Test the relevant hypotheses using a = 0.05.
State the null and alternative hypotheses.
O Ho: at least one of ₁ or ₂ is not 0.
H₂ B₁ B₂=
ⒸH₁: B₁ = B₂ = 0
= = 0
H₂: at least one of ₁ or ₂ is not 0.
Ho: B₁ = B₂ = 0
H₂: neither B₁ nor B₂ is 0.
O Ho: neither B₁ nor B₂ is 0.
H₂: B₁ = B₂ = 0
Calculate the test statistic. (Round your answer to two decimal places.)
F =
Use technology to calculate the P-value. (Round your answer to four decimal places.)
P-value =
What can you conclude?
Reject Ho. We have convincing evidence that the multiple regression model is useful and can conclude that neither B₁
nor
● Reject Ho. We have convincing evidence that the multiple regression model is useful and can conclude that at least one of ₁ or ₂ is
not 0.
O Fail to reject Ho. We do not have convincing evidence that the multiple regression model is useful and cannot conclude that ₁ and
B₂ are both not 0.
ŷ
O Fail to reject Ho. We do not have convincing evidence that the multiple regression model is useful and cannot conclude that at least
one of B₁ or B₂ is not 0.
(d) The authors of the article suggest that a simple linear regression model with the single predictor
length
speed
B₂ is 0.
X =
might be a better model for predicting catch time. Calculate these x values and use them to fit a simple linear regression model. (Round your
numerical values to three decimal places.)
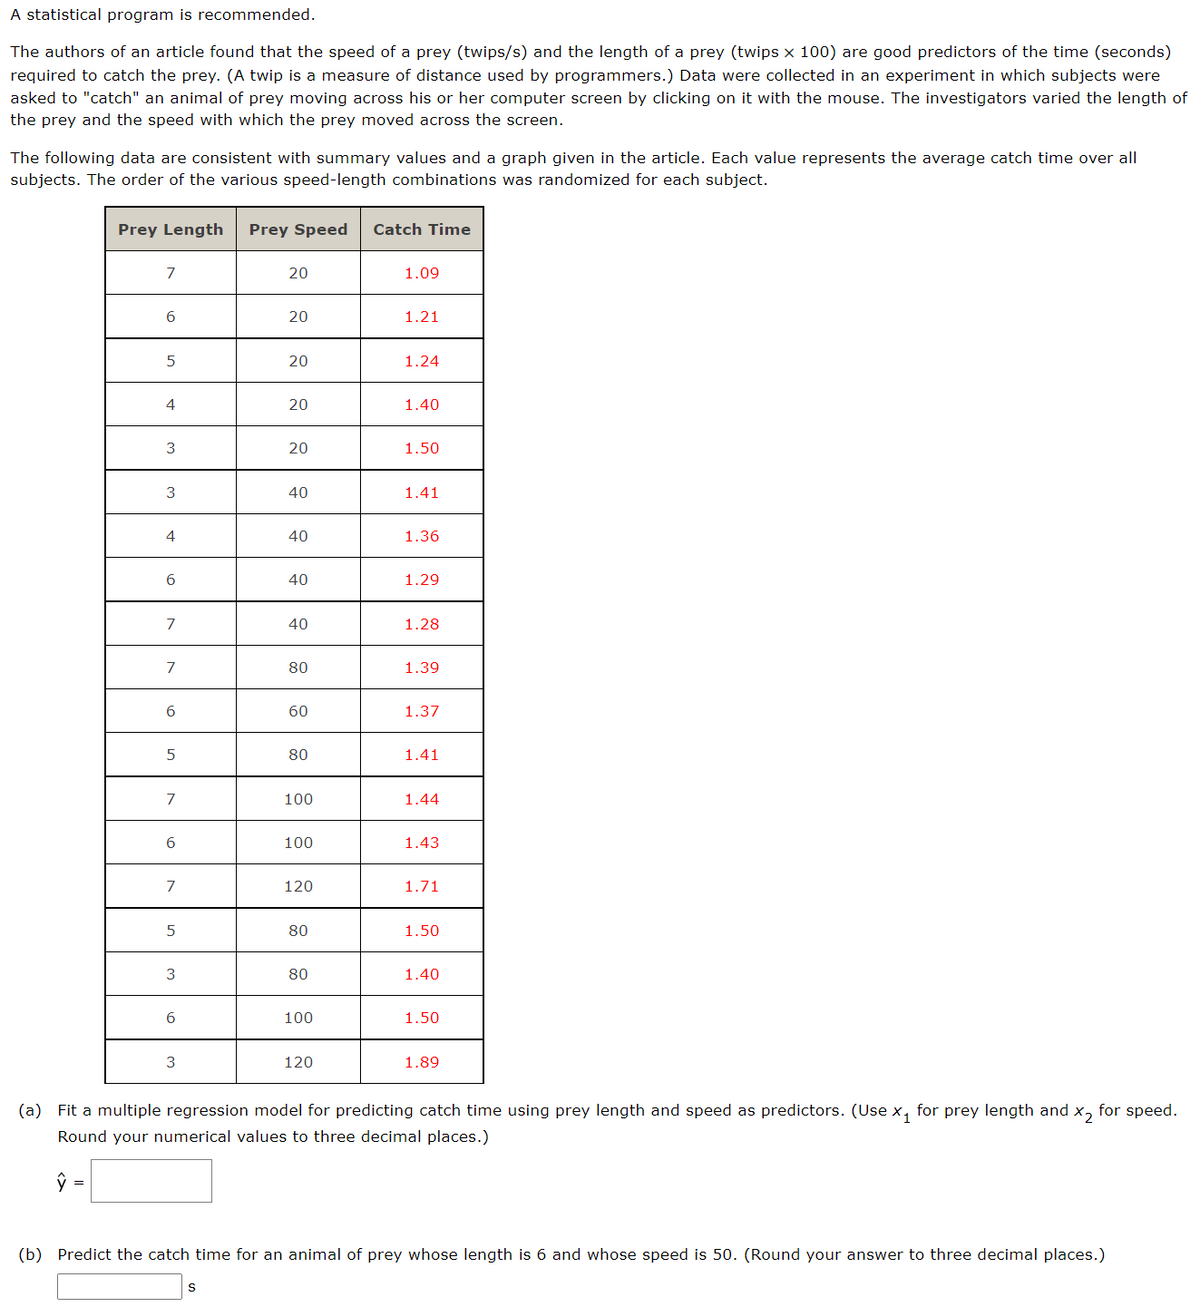
Transcribed Image Text:A statistical program is recommended.
The authors of an article found that the speed of a prey (twips/s) and the length of a prey (twips x 100) are good predictors of the time (seconds)
required to catch the prey. (A twip is a measure of distance used by programmers.) Data were collected in an experiment in which subjects were
asked to "catch" an animal of prey moving across his or her computer screen by clicking on it with the mouse. The investigators varied the length of
the prey and the speed with which the prey moved across the screen.
The following data are consistent with summary values and a graph given in the article. Each value represents the average catch time over all
subjects. The order of the various speed-length combinations was randomized for each subject.
Prey Length Prey Speed Catch Time
7
6
5
4
3
3
4
6
7
7
6
5
7
6
7
5
3
6
3
20
20
S
20
20
20
40
40
40
40
80
60
80
100
100
120
80
80
100
120
1.09
1.21
1.24
1.40
1.50
1.41
1.36
1.29
1.28
1.39
1.37
1.41
1.44
1.43
1.71
1.50
1.40
1.50
1.89
(a) Fit a multiple regression model for predicting catch time using prey length and speed as predictors. (Use x₁ for prey length and x₂ for speed.
Round your numerical values to three decimal places.)
ŷ
(b) Predict the catch time for an animal of prey whose length is 6 and whose speed is 50. (Round your answer to three decimal places.)
Expert Solution
This question has been solved!
Explore an expertly crafted, step-by-step solution for a thorough understanding of key concepts.

This is a popular solution!

Trending now
This is a popular solution!

Step by step
Solved in 3 steps with 1 images

Recommended textbooks for you
Glencoe Algebra 1, Student Edition, 9780079039897…
Algebra
ISBN:
9780079039897
Author:
Carter
Publisher:
McGraw Hill

Big Ideas Math A Bridge To Success Algebra 1: Stu…
Algebra
ISBN:
9781680331141
Author:
HOUGHTON MIFFLIN HARCOURT
Publisher:
Houghton Mifflin Harcourt

Functions and Change: A Modeling Approach to Coll…
Algebra
ISBN:
9781337111348
Author:
Bruce Crauder, Benny Evans, Alan Noell
Publisher:
Cengage Learning
Glencoe Algebra 1, Student Edition, 9780079039897…
Algebra
ISBN:
9780079039897
Author:
Carter
Publisher:
McGraw Hill
Big Ideas Math A Bridge To Success Algebra 1: Stu…
Algebra
ISBN:
9781680331141
Author:
HOUGHTON MIFFLIN HARCOURT
Publisher:
Houghton Mifflin Harcourt
Functions and Change: A Modeling Approach to Coll…
Algebra
ISBN:
9781337111348
Author:
Bruce Crauder, Benny Evans, Alan Noell
Publisher:
Cengage Learning