According to a report done by S & J Power, the mean lifetime of the light bulbs it manufactures is 54 months. A researcher for a consumer advocate group tes this by selecting 31 bulbs at random. For the bulbs in the sample, the mean lifetime is 51 months. It is known that the population standard deviation of the lifetimes is 6 months. Assume that the population is normally distributed. Can we conclude, at the 0.01 level of significance, that the population mean lifetime, μ, of light bulbs made by this manufacturer differs from 54 months? Perform a two-tailed test. Then complete the parts below. Carry your intermediate computations to three or more decimal places, and round your responses as specified below. (If necessary, consult a list of formulas.) (a) State the null hypothesis Ho and the alternative hypothesis H₁. HO H₁ (b) Determine the type of test statistic to use. (Choose one) ▼ (c) Find the value of the test statistic. (Round to three or more decimal places.) 0 (d) Find the two critical values. (Round to three or more decimal places.) and (e) Can we conclude that the population mean lifetime of light bulbs made by this manufacturer differs from 54 months? OYes ONO H X 9. 0=0 a X S 00 Р ê 3 olo Oso 020 ☐☐ OO
According to a report done by S & J Power, the mean lifetime of the light bulbs it manufactures is 54 months. A researcher for a consumer advocate group tes this by selecting 31 bulbs at random. For the bulbs in the sample, the mean lifetime is 51 months. It is known that the population standard deviation of the lifetimes is 6 months. Assume that the population is normally distributed. Can we conclude, at the 0.01 level of significance, that the population mean lifetime, μ, of light bulbs made by this manufacturer differs from 54 months? Perform a two-tailed test. Then complete the parts below. Carry your intermediate computations to three or more decimal places, and round your responses as specified below. (If necessary, consult a list of formulas.) (a) State the null hypothesis Ho and the alternative hypothesis H₁. HO H₁ (b) Determine the type of test statistic to use. (Choose one) ▼ (c) Find the value of the test statistic. (Round to three or more decimal places.) 0 (d) Find the two critical values. (Round to three or more decimal places.) and (e) Can we conclude that the population mean lifetime of light bulbs made by this manufacturer differs from 54 months? OYes ONO H X 9. 0=0 a X S 00 Р ê 3 olo Oso 020 ☐☐ OO

MATLAB: An Introduction with Applications
6th Edition
ISBN:9781119256830
Author:Amos Gilat
Publisher:Amos Gilat
Chapter1: Starting With Matlab
Section: Chapter Questions
Problem 1P

Related questions
Question
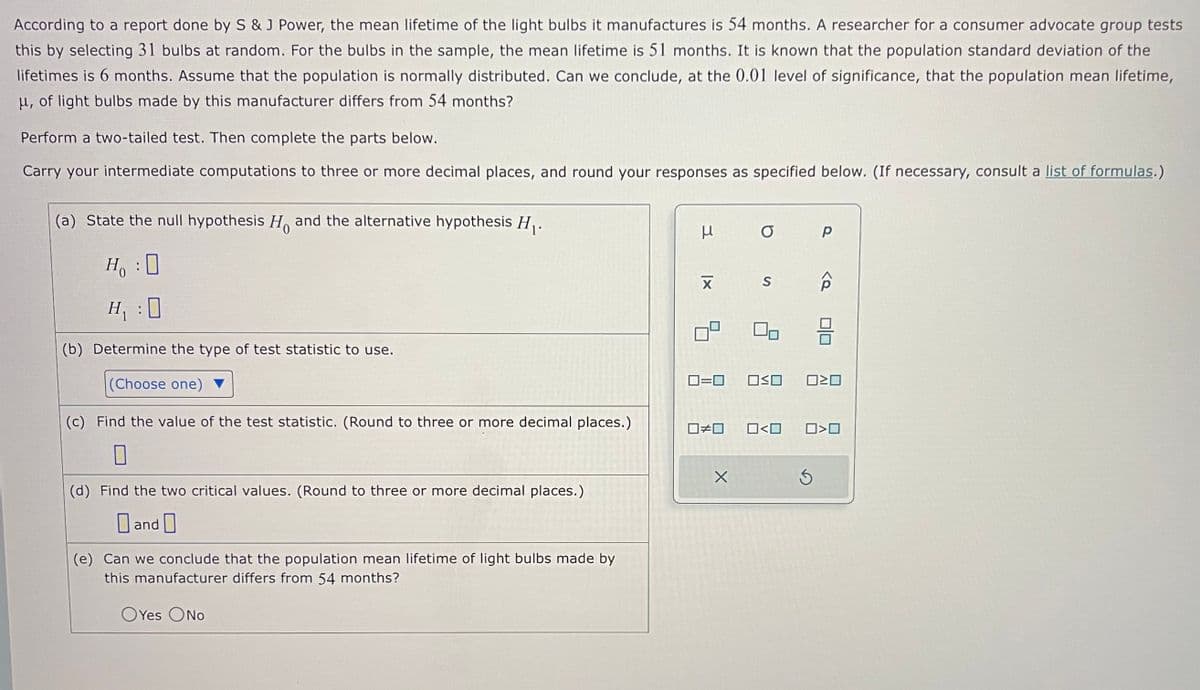
Transcribed Image Text:According to a report done by S & J Power, the mean lifetime of the light bulbs it manufactures is 54 months. A researcher for a consumer advocate group tests
this by selecting 31 bulbs at random. For the bulbs in the sample, the mean lifetime is 51 months. It is known that the population standard deviation of the
lifetimes is 6 months. Assume that the population is normally distributed. Can we conclude, at the 0.01 level of significance, that the population mean lifetime,
μ, of light bulbs made by this manufacturer differs from 54 months?
Perform a two-tailed test. Then complete the parts below.
Carry your intermediate computations to three or more decimal places, and round your responses as specified below. (If necessary, consult a list of formulas.)
(a) State the null hypothesis H and the alternative hypothesis H₁.
Ho
H₁ : 0
H₁ :0
(b) Determine the type of test statistic to use.
(Choose one)
(c) Find the value of the test statistic. (Round to three or more decimal places.)
0
(d) Find the two critical values. (Round to three or more decimal places.)
and
(e) Can we conclude that the population mean lifetime of light bulbs made by
this manufacturer differs from 54 months?
OYes ONO
3
XI
☐
☐#0
O
0=0 OSO
X
S
0<0
р
020
0>0
Ś
Expert Solution
This question has been solved!
Explore an expertly crafted, step-by-step solution for a thorough understanding of key concepts.

This is a popular solution!

Trending now
This is a popular solution!

Step by step
Solved in 2 steps

Recommended textbooks for you
MATLAB: An Introduction with Applications
Statistics
ISBN:
9781119256830
Author:
Amos Gilat
Publisher:
John Wiley & Sons Inc

Probability and Statistics for Engineering and th…
Statistics
ISBN:
9781305251809
Author:
Jay L. Devore
Publisher:
Cengage Learning

Statistics for The Behavioral Sciences (MindTap C…
Statistics
ISBN:
9781305504912
Author:
Frederick J Gravetter, Larry B. Wallnau
Publisher:
Cengage Learning
MATLAB: An Introduction with Applications
Statistics
ISBN:
9781119256830
Author:
Amos Gilat
Publisher:
John Wiley & Sons Inc
Probability and Statistics for Engineering and th…
Statistics
ISBN:
9781305251809
Author:
Jay L. Devore
Publisher:
Cengage Learning
Statistics for The Behavioral Sciences (MindTap C…
Statistics
ISBN:
9781305504912
Author:
Frederick J Gravetter, Larry B. Wallnau
Publisher:
Cengage Learning

Elementary Statistics: Picturing the World (7th E…
Statistics
ISBN:
9780134683416
Author:
Ron Larson, Betsy Farber
Publisher:
PEARSON

The Basic Practice of Statistics
Statistics
ISBN:
9781319042578
Author:
David S. Moore, William I. Notz, Michael A. Fligner
Publisher:
W. H. Freeman

Introduction to the Practice of Statistics
Statistics
ISBN:
9781319013387
Author:
David S. Moore, George P. McCabe, Bruce A. Craig
Publisher:
W. H. Freeman