A statistics instructor claims that statistical knowledge causes an increase in life satisfaction. They want to test this experimentally by randomly assigning 39 students to receive additional statistics education and then assessing life satisfaction to find a mean o and a standard deviation of 23. Another 89 students receive no additional statistic education and are assessed on their life satisfaction to find a mean of 52 and a star deviation of 18. They plan to assess the difference using mu1 - mu2, where 1 mu1 Additional statistics education and 12 mu2 = No additional statistics education Please compute your t-statistics and report to 4 decimal places.
A statistics instructor claims that statistical knowledge causes an increase in life satisfaction. They want to test this experimentally by randomly assigning 39 students to receive additional statistics education and then assessing life satisfaction to find a mean o and a standard deviation of 23. Another 89 students receive no additional statistic education and are assessed on their life satisfaction to find a mean of 52 and a star deviation of 18. They plan to assess the difference using mu1 - mu2, where 1 mu1 Additional statistics education and 12 mu2 = No additional statistics education Please compute your t-statistics and report to 4 decimal places.

MATLAB: An Introduction with Applications
6th Edition
ISBN:9781119256830
Author:Amos Gilat
Publisher:Amos Gilat
Chapter1: Starting With Matlab
Section: Chapter Questions
Problem 1P

Related questions
Question
Answer it correctly please, MY LAST ATTEMPT. I ll rate accordingly. Do it correct and fast. Typed answer only. Explain well.
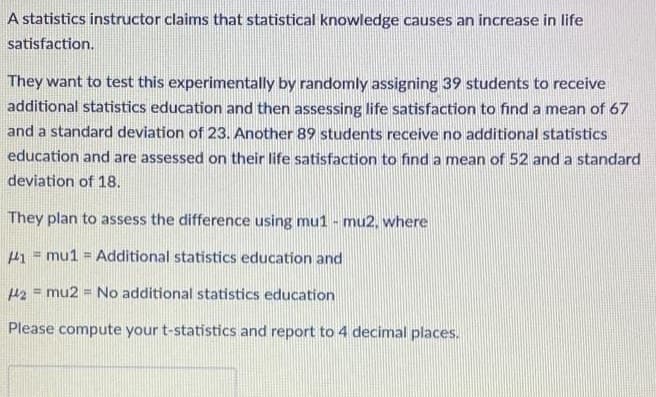
Transcribed Image Text:A statistics instructor claims that statistical knowledge causes an increase in life
satisfaction.
They want to test this experimentally by randomly assigning 39 students to receive
additional statistics education and then assessing life satisfaction to find a mean of 67
and a standard deviation of 23. Another 89 students receive no additional statistics
education and are assessed on their life satisfaction to find a mean of 52 and a standard
deviation of 18.
They plan to assess the difference using mu1 - mu2, where
1 mu1 = Additional statistics education and
2 mu2 = No additional statistics education
=
Please compute your t-statistics and report to 4 decimal places.
Expert Solution
This question has been solved!
Explore an expertly crafted, step-by-step solution for a thorough understanding of key concepts.

This is a popular solution!

Trending now
This is a popular solution!

Step by step
Solved in 2 steps with 1 images

Recommended textbooks for you
MATLAB: An Introduction with Applications
Statistics
ISBN:
9781119256830
Author:
Amos Gilat
Publisher:
John Wiley & Sons Inc

Probability and Statistics for Engineering and th…
Statistics
ISBN:
9781305251809
Author:
Jay L. Devore
Publisher:
Cengage Learning

Statistics for The Behavioral Sciences (MindTap C…
Statistics
ISBN:
9781305504912
Author:
Frederick J Gravetter, Larry B. Wallnau
Publisher:
Cengage Learning
MATLAB: An Introduction with Applications
Statistics
ISBN:
9781119256830
Author:
Amos Gilat
Publisher:
John Wiley & Sons Inc
Probability and Statistics for Engineering and th…
Statistics
ISBN:
9781305251809
Author:
Jay L. Devore
Publisher:
Cengage Learning
Statistics for The Behavioral Sciences (MindTap C…
Statistics
ISBN:
9781305504912
Author:
Frederick J Gravetter, Larry B. Wallnau
Publisher:
Cengage Learning

Elementary Statistics: Picturing the World (7th E…
Statistics
ISBN:
9780134683416
Author:
Ron Larson, Betsy Farber
Publisher:
PEARSON

The Basic Practice of Statistics
Statistics
ISBN:
9781319042578
Author:
David S. Moore, William I. Notz, Michael A. Fligner
Publisher:
W. H. Freeman

Introduction to the Practice of Statistics
Statistics
ISBN:
9781319013387
Author:
David S. Moore, George P. McCabe, Bruce A. Craig
Publisher:
W. H. Freeman