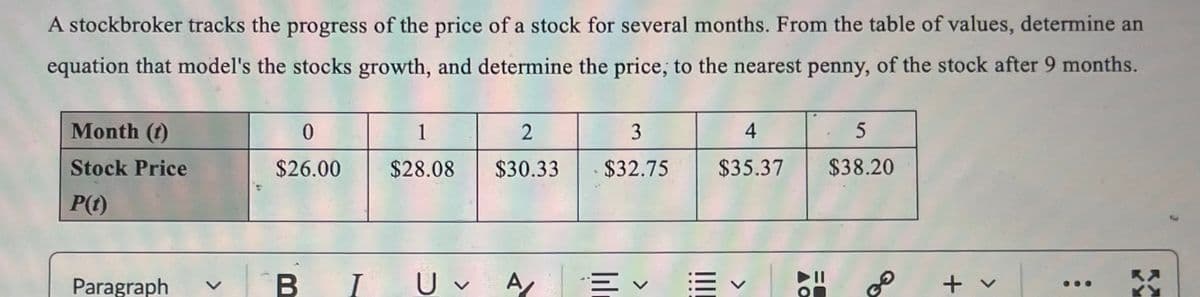
A stockbroker tracks the progress of the price of a stock for several months. From the table of values, determine an equation that model's the stocks growth, and determine the price; to the nearest penny, of the stock after 9 months. Month (1) Stock Price P(1) 0 $26.00 1 $28.08 2 $30.33 3 $32.75 4 $35.37 5 $38.20


Q: You wish to test the following claim (1) at a significance level of a-0.02. Ho: 06.3 Hy: > 66.3 You…
A: The null and alternative hypothesis isH0:H1:sample size(n)=20Mean()=73.4standard…
Q: Which of the following misuses of statistics is possible when we make type II errors, but not if we…
A: Type I error occurs when we reject a true null hypothesis (false positive), and type II error occurs…
Q: The sampling distribution of the sample mean is shown. If the sample size is n = 16, what is the…
A: The graph represents sampling distribution for sample mean. Sample size : n = 16Population standard…
Q: Forty eight subjects were randomly assigned to one of 4 treatment conditions in a study of different…
A: we can perform an analysis of variance (ANOVA) using the given information.Let's denote the means…
Q: that the In order to set rates, an insurance company is trying to est standard deviation is 2.8…
A:
Q: Calculate the standard score of the given X value
A: Given that,Score Population mean Population standard deviation
Q: For the wheel pictured on the right, assume that a person spins the pointer and is awarded the…
A: A person spins the pointer and is awarded the amount indicates by the pointer.The objective is to…
Q: Given the returns and probabilities for the three possible states listed below, calculate the…
A: Expected Return of Stock : . Expected Return of Stock : .The returns and probabilities for the…
Q: If n = 170 and X = 136, construct a 95% confidence interval for the population proportion, p. Give…
A: Since you have posted multiple questions, we will provide the solution only to the first question as…
Q: Imagine an experiment in which a set of subjects were administered an experimental drug designed to…
A: The data set is,BeforeAfter121162211832121423225202062118723168202092219101820
Q: An over-the-counter drug manufacturer wants to examine the effectiveness of a new drug in curing an…
A: the regression model:the coefficients from the model:
Q: 2.Complete the ANOVA table or write bellow SST, MSW, MSB and F-test statistics. (Show work to earn…
A: Total sum= between group sum+ within group sum
Q: Among 24- to 29-year-olds, 31% say they have used a computer while under the influence of alcohol.…
A: Here, X represents 24- to 29-year-olds using computer while under the influency of alcohol which…
Q: Open an excel file, and enter the data as follows: The net weights (in grams) of a sample of bottles…
A: Hypothesis testing is a tool for making statistical inferences about the population data. It is an…
Q: We want to estimate the causal effect of D through regression, and S allows a perfect…
A: The casual effect of D needs to be estimated through regression and S allows a perfect…
Q: An engineer has designed a valve that will regulate water pressure on an automobile engine. The…
A: The question is about hypothesis testingGiven :Population mean pressure of valve ( ) = 5.2…
Q: Fill in the missing value so that the following table represents a probability distribution. x 35 45…
A: The probability distribution is given with missing value.
Q: Given the 8 letters in the word ABSOLUTE, a. How many ways can the letters be rearranged? b. How…
A: Number of arrangements of letters.
Q: A random sample of the closing stock prices in dollars for a company in a recent year is listed…
A: The confidence interval is the range of values that you expect your estimate to fall between a…
Q: A survey found that women's heights are normally distributed with mean 63.6 in and standard…
A: The sample mean [x] =63.6The standard deviation [s] =2.3
Q: have no preliminary estimate for p, how many medical files should you include in a random sample in…
A: 0.93 confidence level. Margin of error =0.05
Q: Before every flight, the pilot must verify that the total weight of the load is less than the…
A: The question is sampling distributionGiven :Population mean weight ( ) = 182.2 lbPopulation…
Q: Let X = 1 if a randomly selected vehicle passes an emissions test and X = 0 otherwise. Then X is a…
A: X~Ber(p)
Q: Returns on stocks X and Y are listed below: Period 1 2 3 4 5 6 7 Stock X…
A: Solution:- StockX = c(6, 5, -2, 10, 3, 8, -4)> StockY = c(11, 7, 10,…
Q: Consider an economy where each worker is employed in either agriculture or services. Assume that log…
A: In this economic model, workers are employed in either agriculture or services, and their earnings…
Q: Find the Z-scores that separate the middle 41% of the distribution from the area in the tails of the…
A: The standard normal distribution has a mean (μ) of 0 and a standard deviation (σ) of 1.
Q: Indicate: a) width of classes b) number (amount) of sample data c) number of classes
A: It is given that the grouped frequency distribution table represents the number of person and their…
Q: An article in a professional journal reports the z-score for the study’s sample mean was z = –1.4.…
A: From the provided information,z = -1.4Sample mean (x̄) = 97Sample size (n) = 49Population mean (µ) =…
Q: (c) Compare the results from par (a) What is the minimum sample size needed assuming that no prior…
A: It is given that Margin of error, E = 4% = 0.04Confidence level = 90%
Q: Cars enter a car wash at a mean rate of 3 cars per half an hour. What is the probability that, in…
A: Suppose a random variable x defines the number of cars enter in a car wash per hour.
Q: 0⁰ (a) Shade the area under the curve corresponding to P(13 < x < 25). 0 0⁰ 12 0⁰ 24 12 (b) Shade…
A: It is given that the random variable X denote the lifetime ( in thousands of hours ) of a certain…
Q: Suppose that 3% of the 2 million high school students who take the SAT each year receive special…
A:
Q: EXERCISE 32 Let X₁,..., Xn iid Geometric(p). Show that the MLE and MM estimat ô = 1/Ã is a biased…
A: Let are identically independently distributed variables that follow Geometric distribution of…
Q: € cell phones dollars square dollars is ne
A: According to the given information in this questionwe need to find the value of margin of error and…
Q: a. How many observations does the sample contain? b. What is the chi-square value for the…
A: From the given summary output, the number of observations = 189
Q: 22) The taxi and takeoff time for commercial jets is a random variable x with a mean of 8.5 minutes…
A: In the given question, the following informations are provided:Population mean (μ) = 8.5…
Q: Using the t-table, find the critical values for a right-tailed test with a significance level of 10%…
A: The test is right-tailed test.The level of significance is The sample size is The objective is to…
Q: hy is the median the best representation
A: The mean,,,median,, 99, 254); position: relative; display: inline-block;">mean, median, and mode…
Q: Maricel wanted to compare the number of vocabulary words a child knows about the solar system to…
A: From the given information, the coefficient of constant is 3.371, the coefficient of age is 2.1143,…
Q: For this series of questions, you will conduct an F test and a two-tailed t-test on samples from the…
A: Set ASet B151917181818191720152015241313
Q: The body temperatures of adults have a mean of 98.6° F and a standard deviation of 0.60° F. If 36…
A: Mean()=98.6standard deviation()=0.60sample size(n)=36
Q: The annual earnings (in dollars) of 35 randomly selected microbiologists are shown in the data…
A: The formula of the sample mean is,The formula of the sample standard deviation is,The formula of…
Q: K c=0.90, x= 16.4, o 8.0, and n = 80 H. A 90% confidence interval for u is (.). (Round to one…
A: Sample size (n) = = 80, x̄ = 16.4 and σ = 8.0
Q: Assume that Friday morning taxi-cab rides have times with a standard deviation of o=9.9 minutes. A…
A: Sample size(n)=12sample mean()=20.9Sample standard deviation(s)=12.6and =0.01
Q: Prepare a frequency distribution table to present the blood pressure of 32 patients who visited the…
A: The data of patient's blood pressure is given here,The objective is to construct the frequency…
Q: (a) What is the probability that the airline can accommodate everyone who shows up for the flight?…
A: Let X be the random variable that is the number of people who actually show up for a sold-out…
Q: To see if the average number of family-owned daycares per county is greater than the average number…
A: Hypothesis testing is a tool for making statistical inferences about the population data. It is an…
Q: A survey found that women's heights are normally distributed with mean 63.4 in. and standard…
A: The variables is defined below as follows:Let X denotes the men’s heights which follows normal…
Q: Problem #3: (a) In an investigation of toxins produced by molds that infect corn crops, a biochemist…
A: Data : 1.3, 1.3, 1.8, 1.9, 2.5, 2.5Now we have to find mean and Sample standard deviationMean…
Q: Find the 95% confidence interval for the standard deviation of population using below data:…
A: 24,48,86,87,24,26,58,67,45,86,22,48sample size(n)=12confidence level=95%

Step by step
Solved in 3 steps with 17 images

- - The management has decided to hire a new marketing director. Based on the table given and the prices staying the same, the volume of sales and the revenue show a decreasing trend. -The interview process requires the candidate to design a plan that will increase the revenue for the following year during the first 3 months. Each monthly revenue should increase by $1,000. The price for each type of fruit should not be increased by more than one dollar. One candidate offers the option to increase the sales amounts in hundreds to the values below. Is this an acceptable opyion? Will the candidate get the job? Sales in Hundreds April May June Stawberries 9 8 6 Apples 10 9 8 Pineapples 6 9 5 Monthly revenue in hundredsBallistics Ballistics experts are able to identify theweapon that fired a certain bullet by studying the markings on the bullet after it is fired. They test the rifling(the grooves in the bullet as it travels down the barrelof the gun) by comparing it to that of a second bulletfired into a bale of paper. The speed, s, in centimeters per second, that the bullet travels through the paper isgiven by s = 3013 - 10t2 3, where t is the time afterthe bullet strikes the bale and t … 0.3 second.a. Complete the following table to find the speed forgiven values of t. b. Use the root method to find the number of secondsto give s = 0. Does this agree with the data in thetable?Using the equation from line of best fit estimate the youngest age to be to have a 4.0 Line of best fit equation Y= 0.019084x+3.97814
- If we increase our food intake, we generally gain weight. Nutrition scientists can calculate the amount of weight gain that would be associated with a given increase in calories. In one study, 16 nonobese adults, aged 25 to 36 years, were fed 1000 calories per day in excess of the calories needed to maintain a stable body weight. The subjects maintained this diet for 8 weeks, so they consumed a total of 56,000 extra calories. According to theory, 3500 extra calories will translate into a weight gain of 1 pound. Therefore, we expect each of these subjects to gain 56,000/3500 = 16 pounds (lb). Here are the weights before and after the 8-week period, expressed in kilograms (kg). Subject 1 2 3 4 5 6 7 8 Weight before 55.7 54.9 59.6 62.3 74.2 75.6 70.7 53.3 Weight after 61.7 58.7 66.0 66.2 79.1 82.2 74.2 59.3 Subject 9 10 11 12 13 14 15 16 Weight before 73.3 63.4 68.1 73.7 91.7 55.9 61.7 57.8 Weight after 79.1 66.1 73.5 76.8 93.0 63.0 68.1 60.2 Find the mean (x bar) and the…If we increase our food intake, we generally gain weight. Nutrition scientists can calculate the amount of weight gain that would be associated with a given increase in calories. In one study, 16 nonobese adults, aged 25 to 36 years, were fed 1000 calories per day in excess of the calories needed to maintain a stable body weight. The subjects maintained this diet for 8 weeks, so they consumed a total of 56,000 extra calories. According to theory, 3500 extra calories will translate into a weight gain of 1 pound. Therefore, we expect each of these subjects to gain 56,000/3500 = 16 pounds (lb). Here are the weights before and after the 8-week period, expressed in kilograms (kg). Subject 1 2 3 4 5 6 7 8 Weight before 55.7 54.9 59.6 62.3 74.2 75.6 70.7 53.3 Weight after 61.7 58.7 66.0 66.2 79.1 82.2 74.2 59.3 Subject 9 10 11 12 13 14 15 16 Weight before 73.3 63.4 68.1 73.7 91.7 55.9 61.7 57.8 Weight after 79.1 66.1 73.5 76.8 93.0 63.0 68.1 60.2 Report the 95% confidence…Exercises: 1. Evapotranspiration rate is an imporant ecological and climatological variable. It describes how fast water is being evaporated from Earth’s surface and transpired by vegetation. Thus it describes the rate at which moisture is supplied to the atmosphere from the land. The evapotranspiration rate (or ET for short) usually cannot be estimated directly, and instead is calculated from the difference between the rates of rainfall (or P for short) and runoff (or R for short). (Note: the expression below assumes that recharge and discharge to groundwater are in balance, so that there are no changes in storage.) ET = P – R At the Birkenes watershed in southern Norway, 16 years of monitoring data indicate that annual rainfall is 1483±265 mm/yr (mean±standard deviation) and annual runoff is 1170±306 mm/yr (mean±standard deviation) (a) If this was all you knew (i.e., if you knew nothing about whether the rainfall and runoff were correlated positively or negatively, and so assumed…
- referring to the image please help me find the correct terms for each 1 .variable a.)The average length of time (in months) AIDS patients live after treatment. b.)The 40 AIDS patients in the study. c.) The average length of time (in months) AIDS patients live after treatment in the sample d.) AIDS patients e.) X=the length of time (in months) AIDS patients live after treatment. 2.Parameter a.)The average length of time (in months) AIDS patients live after treatment. b.)The 40 AIDS patients in the study. c.) The average length of time (in months) AIDS patients live after treatment in the sample d.) AIDS patients e.) X=the length of time (in months) AIDS patients live after treatment. 3.Statistic a.)The average length of time (in months) AIDS patients live after treatment. b.)The 40 AIDS patients in the study. c.) The average length of time (in months) AIDS patients live after treatment in the sample d.) AIDS patients e.) X=the length of time (in months) AIDS patients live after…A college bookstore must order books two months before each semester starts. They believe that the number of books that will ultimately be sold for any particular course is related to the number of students registered for the course when the books are ordered. They would like to develop a bestfitting line to predict how many books to order. From past records, the bookstore obtains the number of students registered, X, and the number of books actually sold for a course, Y , for 12 different semesters.A scatterplot of the data along with the best fitting line is presented below. a. The correlation between the two variables is r = .89. Calculate and interpret the value of r2.b. The equation for the best fitting line is Y = 9.30 + 0.673X. Explain and interpret the value of 9.30.c. How many books should the store order for a class of 50 students? Would you trust this prediction?A car dealership wants to try out a new leasing arrangement, which will allow a buyer to trade a car back to the dealership for a certain amount of credit at any time throughout the first five years of ownership. For a car in good condition, the arrangement will value the car at 1515 the original price at the end of five years, and will depreciate the value of the car linearly over the course of the five years. What is the value of a car with initial purchase price P at the end of the first year? Write your answer as an expression in terms of P. Write the exact answer. Do not round.
- The success of a project depends on the effort level of a worker. In case of successthe revenues will be 400,000 TL whereas in case of no-success the revenues will be 0. The workercan provide a low effort level or a high effort level. The effort level cannot be observed by theprincipal. The worker requires an expected salary of 60,000 TL to provide the low effort leveland an expected salary of 80,000 TL to provide the high effort level. The success probabilitiesfor the project are 40% in case of low effort level and 80% in case of high effort level. Whatshould be the minimum bonus (that is awarded in addition to the base salary in case of success)and the base salary for the worker so that the worker has the incentives to provide the higheffort level?The price of a one-way Amtrak train ticket between Washington and Boston was $64.00 in 2004. In 2020, that same ticket costs $129.00. A Greyhound Bus ticket between the same two cities cost $28.00 in 2004 and $45.00 in 2020. 2004 A 2020 B Amtrak $64.00 $129.00 Grey Hound $22.00 $45.00 Which ticket has increased more in relative terms (%)? Show your calculations to back up your answer. Adjusting for inflation, what is the percentage increase in the cost of the Amtrak ticket between 2004 and 2020?Visualize that two tributaries A and B at their confluence form a river C. Statistical properties of flow data for tributaries A and B indicate that tributary A has a yearly discharge rate smaller than its mean flow rate (?̅?) in 50% of the years while tributary B has a yearly discharge rate smaller than its mean flow rate (?̅?) in 60% of the time. In 70% of the years in which tributary A has a discharge rate smaller than its mean discharge rate (?̅?), tributary B also has a discharge rate smaller than its mean discharge rate (?̅?). Compute the probability that (i) both tributaries have a discharge rate smaller than their mean discharge rates, (ii) at least one tributary has a discharge rate smaller than its mean discharge rate, (iii) tributary A has a discharge rate smaller than its mean discharge rate given that tributary B has a discharge rate smaller than its mean discharge rate, (iv) at least one tributary has discharge rate higher than its mean discharge rate, and (v) probability…


