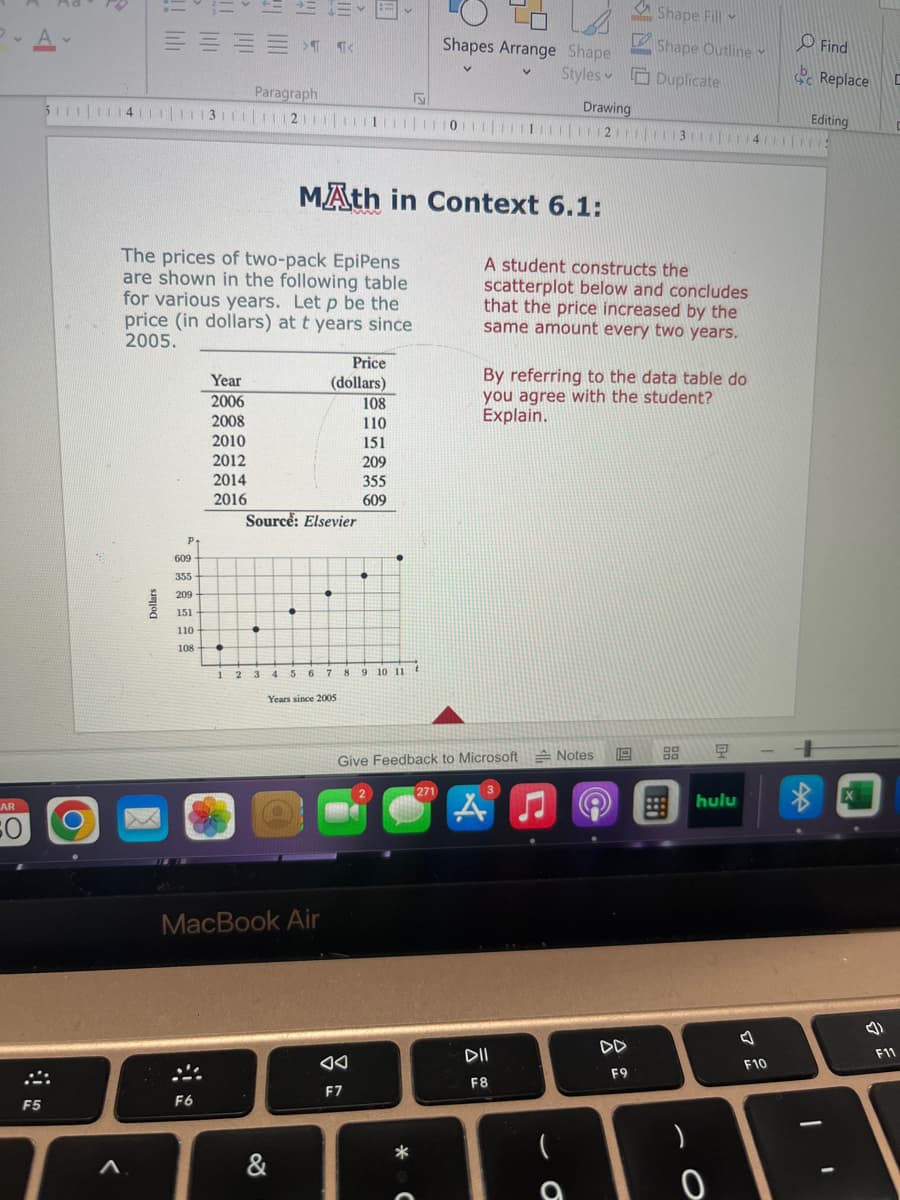
A student constructs the scatterplot below and concludes that the price increased by the same amount every two years. By referring to the data table do you agree with the student? Explain.


Q: QUESTION The desired probability car be written as P (T< A) = 1 - e-BXA What is the value of 42
A: We can solve for A by rearranging the equation to isolate A: P(T < A) = 1 - e ^ (- B * A) e ^…
Q: D ency 0.30 Cardiovascular nt in the bar plot but not in t nt in the pie chart but not in u prefer…
A: *Answer:
Q: In statistical comparisons, a p-value represents the likelihood that an observation was merely due…
A: This question is asking us to examine Table 1 in a research article and determine which…
Q: - A data set about speed dating includes "like" ratings of male dates made by the female dates. The…
A:
Q: For each of the following, decide whether the proper inference is a prediction interval for y or a…
A: We have to decide which one is predictive interval or the confidence interval.
Q: Baby weight: Following are weights, in pounds, of 10 two-month-old baby girls. It is reasonable to…
A: Given that, The data is xi 8.63 12.95 8.51 12.23 14.13 11.87 12.32 10.30…
Q: 3. Score 95 or lower? T 4. Score 95 or higher?
A:
Q: We have calculated a 95% confidence interval and would prefer for our next confidence interval to…
A: The 95% confidence interval was calculated and would prefer the next confidence interval to have a…
Q: 5. A company of 450 factories. Management is interested in average break downs (X) of production…
A: Given information: N=450, μ=120, σ2=20, n=60, and x¯=100
Q: Q_I find the number of words Composed a different letters can be formed from the I letters of word…
A: Objective of this question is that find the number ways to composed a word having size 3.
Q: 5. The mean birth weight for babies born one month early is 2630 grams. Assume standard deviation of…
A: Let X be the random variable from normal distribution with mean (μ) = 2630 and standard deviation…
Q: It is commonly believed that the mean body temperature of a healthy adult is 98.6° F. You are not…
A:
Q: Persons who visit the restroom of a certain fast-food outlet were asked to state their opinion of…
A: Given that: Gender of Respondent Totals Male Female Qualities of Facilities Above…
Q: Do various occupational groups differ in their diets? A British study of this question compared 98…
A: Introduction The sample mean is denoted by x¯ and the sample sd is denoted by s.
Q: The z value for a 96.6% confidence interval estimate is OA. 1.82 B. 2.12 OC. 2.00
A: As per Bartleby guidelines I can't answer more than one question per post. Please post other…
Q: Cats, Part II. Exercise 7.30 presents regression output from a model for predicting the heart weight…
A: Given Information: Estimate Standard Error T Value Pr(>|t|) (Intercept) -0.357 0.692…
Q: Probability Scores 0.25 2 0.15 3 0.08 5 0.1 7 0.12 8 0.3 12 Find the expected value of the above…
A: It is given that the probability scores of a random variable.
Q: A magazine collects data each year on the price of a hamburger in a certain fast food restaurant in…
A: The obtained sample observations of the price (in $) of hamburgers are: 5.16, 4.98, 4.05, 4.66,…
Q: 45 Identify the test statistic for this hypothesis test. The P-value for this hypothesis test is…
A: Answer X=165 n =5871 hatp =165/5871 = 0.0281 alpha = 0.01 3% = 3/100 = 0.03
Q: Calculate the minimum profit, maximum profit, standard deviation of this question using excel:…
A: Solution: From the given information,
Q: Assume that a randomly selected subject is given a bone density test. Those test scores are normally…
A: Obtain the Z-score for the probability of a bone density test score less than 0. The Z-score for the…
Q: A study was conducted to measure the effectiveness of hypnotiam in reducing pain. The measurements…
A: Given data:
Q: Assume that adults have IQ scores that are normally distributed with a mean of μ= 100 and a standard…
A: Mean(μ)=100 Standard deviation(σ)=15
Q: Which of the following is NOT an equivalent expression for the confidence interval given by 161.7 <…
A: The confidence interval for the population mean is equal to = 161.7<mu < 189.5
Q: Sarah has been offered a softball scholarship to two universities. She is trying to decide which…
A: We have to make comparison in two universities for their softball scholarship.
Q: In a study to estimate the proportion of residents in a city that support the construction of a new…
A:
Q: A population of values has a normal distribution with μ = 165.6 and σ = 44.9. You intend to draw a…
A: Given data, μ=165.6 σ=44.9 n=184
Q: 1. Simpson's paradox results from a variable omitted in the pooled table acting as a lurking…
A: Solution-: Simpson's paradox results from a variable omitted in the pooled table acting as a lurking…
Q: According to data for a population, 3-year-old boys have a mean height of 39 inches and a standard…
A: Answer Mean of height =39 sample standard deviation =2 We know that Z-score: Z = [x-mu]/sigma.
Q: Find the indicated z score. The graph depicts the standard normal distribution with mean 0 and…
A: According to the given information, we know that, P-value is given i.e. P-value = 0.1292 (Right…
Q: Consider the following hypothesis test: Ho: μ > 20 Ha: μ< 20 A sample of 40 provided a sample mean…
A: As per the Bartleby guildlines solve part(d) as specified by the student.... Given that Sample…
Q: Dog researchers are trying to determine if the brand of dog bed effects how much sleep dogs get. me…
A: x̄1=14.6, sample x̄2=15.7, n1=24, n2=32, s1=23, s2=1.8
Q: If n=130 and p' (p-prime) = 0.54, construct a 99% confidence interval. Give your answers to three…
A: Given, sample size(n)=130 Sample proportion(p^)=0.54
Q: Ho: p≥ 0.75 Ha: p < 0.75 A sample of 300 items was selected. Compute the p-value and state your…
A: HYPOTHESIS:H0:p≥0.75Ha:p<0.75n=300α=0.05we have to find out the p-value for the given data.
Q: 5. A Senator wants to know what the voters of his state think of proposed legislation on gun…
A: Population is larger in size compare to sample. Population is the whole set of observations that are…
Q: A charity organization is selling $50 raffle tickets as part of a fund-raising program. The grand…
A: a) Suppose the random variable x denotes the net winning earned from buying one ticket.
Q: The 68‑95‑99.7 rule tells us how to find the middle 68%, 95%, or 99.7% of a Normal distribution.…
A: Answer:- According to the empirical rule (the 68‑95‑99.7 rule) 68%, 95%, and 99.7% of the data…
Q: The lifetime of a certain type of battery is known to be normally distributed with standard…
A: This question is about constructing a 95% confidence interval for the mean lifetime of a certain…
Q: A company produces steel rods. The lengths of the steel rods are normally distributed with a mean of…
A: We have given that Mean=120.2, Standard deviation=2.1
Q: What sample size is needed so that the standard deviation of the sampling distribution is 0.01 grams…
A: Formula : σ_x̄ = σ/√n
Q: Proble 1. A four-year study of various brands of bottled water found that 30% of bottled water is…
A:
Q: Consider the hypothesis test below. Ho: P1 P2 ≤0 H₁ : P1 - P2 > 0 The following results are for…
A: The hypotheses are given as- H0:p1-p2≤0Ha:p1-p2>0 The data for two samples is given as-…
Q: The proportion of twins born in a town is p = 0.12. Suppose we randomly select 100 women from this…
A: Here the given information is The proportion of twins born in a town is p = 0.12. Suppose we…
Q: The National Center for Health Statistics reports that systolic blood pressure for males 35 to 44…
A: It is given that: The claimed average systolic blood pressure (i.e., the reported average blood…
Q: Assume that a randomly selected subject is given a bone density test. Those test scores are normally…
A: Let Z be the random variable from standard normal distribution with mean = 0 and standard deviation…
Q: Given the following images determine the areas under the normal curve: 1. Area: 2. Area: 3. Area:…
A: The question is about normal distribution Introduction : i ) z is a std. normal r.v which follows…
Q: Find P(z≤1.55):
A: Answer:- We use standard normal table to calculate the required Probability. Here, we need to find…
Q: State the null and alternative hypotheses for a hypothesis test; indicate whether the hypothesis…
A: given data claim : p>0.61 we have to identify pair of hypothesis, type of test :left, right or…
Q: what about P(−0.89 ≤ z ≤1 .79).
A: We use standard normal table to calculate the required Probability. Here, we need to find the…
Q: ← A genetic experiment with peas resulted in one sample of offspring that consisted of 435 green…
A: given data,green peas -435yellow peas-161total peas -596we have to find out the given confidence…


Trending now
This is a popular solution!

Step by step
Solved in 3 steps

- Suppose a company charges a premium of $150 per year for an insurance policy for storm damage to roofs. Actuarial studies show that in case of a storm, the insurance company will pay out an average of $8000 for damage to a composition shingle roof and an average of $12,000 for damage to a shake roof. They also determine that out of every 10,000 policies, there are 7 claims per year made on composition shingle roofs and 11 claims per year made on shake roofs. What is the company’s expected value (i.e., expected profit) per year of a storm insurance policy? What annual profit can the company expect if it issues 1000 such policies? Determine the probability of a composition shingle roof claim out of 10,000 = ______ Determine the probability of a shake roof claim out of 10,000 = ______ How many claims are made out of 10,000? = _______ What is the probability of no claims out of 10,000? = _______ How much does each shingle roof claim cost the company, don’t forget each person pays $150…The management of the local zoo wants to know if all of their animal exhibits are equally popular. If there is significant evidence that some of the exhibits are not being visited frequently enough, then changes may need to take place within the zoo. A tally of visitors is taken for each of the following animals throughout the course of a week, and the results are contained in the following table. At α=0.005, determine whether there is sufficient evidence to conclude that some exhibits are less popular than others. Animal Exhibits at the Zoo Elephants Lions/Tigers Giraffes Zebras Monkeys Birds ReptilesNumber of visitors 152 175 185 144 145 171 163 Step 2 of 4 : Calculate the expected value for the number of visitors for the birds exhibit. Enter your answer as a fraction or a decimal rounded to three decimal places. Step 3 of 4: Compute the value of the test statistic. Round any calculations to at least six decimals places and round your final answer to three…Assume that σ12 = σ22 = σ2. Calculate the pooled estimator of σ2 for s12=50, s22=57 and n1 =n2 =18.
- An SRS of 100 flights by Speedy Airlines showed that 64 were on time. An SRS of 100 flights by Happy Airlines showed that 80 were on time. Let pS be the proportion of on-time flights for all Speedy Airline flights, and let pH be the proportion of all on-time flights for all Happy Airlines flights. Is there evidence of a difference in the on-time rate for the two airlines? To determine this, you test the hypotheses H0 : pS – pH 0, Ha : pS – pH 0. The P-value of your test is 0.0117. Which of the following is an appropriate interpretation of the P-value? a. If the on-time rates for the two airlines are equal, there is a 0.0117 probability of getting samples with a difference as far or farther from zero as these samples. b. If the on-time rates for the two airlines are not equal, the probability of getting samples with a difference as far or farther from zero as these samples is 0.9883. c. The probability of making a Type I error is 0.0117. d. The probability of making a Type II error…The management of the local zoo wants to know if all of their animal exhibits are equally popular. If there is significant evidence that some of the exhibits are not being visited frequently enough, then changes may need to take place within the zoo. A tally of visitors is taken for each of the following animals throughout the course of a week, and the results are contained in the following table. At α=0.05, determine whether there is sufficient evidence to conclude that some exhibits are less popular than others. Animal Exhibits at the ZooElephants Lions/Tigers Giraffes Zebras Monkeys Birds ReptilesNumber of visitors 137 129 161 147 160 134 131 Step 3 of 4 : Compute the value of the test statistic. Round any intermediate calculations to at least six decimal places, and round your final answer to three decimal places. Step 4 of 4: Draw a conclusion and interpret the decision. (Reject or fail to reject, Is there enough evidence or not?)The management of the local zoo wants to know if all of their animal exhibits are equally popular. If there is significant evidence that some of the exhibits are not being visited frequently enough, then changes may need to take place within the zoo. A tally of visitors is taken for each of the following animals throughout the course of a week, and the results are contained in the following table. At α=0.05, determine whether there is sufficient evidence to conclude that some exhibits are less popular than others. Animal Exhibits at the Zoo Elephants Lions/Tigers Giraffes Zebras Monkeys Birds Reptiles Number of visitors 139 136 169 125 174 137 174 Copy Data Step 3 of 4 : Compute the value of the test statistic. Round any intermediate calculations to at least six decimal places, and round your final answer to three decimal places.
- A 6-foot sub valued at $25 is divided among five players (P1, P2, P3, P4, P5) using the last diminisher method. The players play in a fixed order, with Pl first, P2 second, and so on. I round 1, P1 makes the first cut and makes a claim on a C-pièce. For each of the remaining players, the value of the current C-piece at the time it is their turn is given in the following table: a.) What is the fair share for each player? Show your work in the space provided below. b.) What does player 2 do with the piece and why? c.) What does player 3 do with the piece and why? d.) What does player 4 do with the piece and why? e.) What does player 5 do with the piece and why? £) Who gets the piece at the end of round 2 and why is it that person? g.) What is the value of the piece?In 42 of the 64 years from 1950 through 2014,the S& P 500 finished higher after the first five days of trading (in 2011 there was virtually no change). In 37 out of 42 years, the S&P 500 finished higher for the year. Is a good first week a good omen for the upcoming year? The following table gives the first-week and annual performance over this 64-year period. First week Higher Lower Total Higher 37 5 42 Lower 11 11 22 Total 48 16 64 -what is the probability that the S&P 500 finished lower for the year? -b) Given that the S&P fiished lowerr after the first five days of trading,what is the proability that it finished lower for the year? -c) Are the two events "first week performance" and "annual performance"independent? why?Suppose the customers arrive at a Poisson rate of on eper every 12 minutes, and that the service time is exponential at a rate of one service per 8 minutes. What are the average number of customers in the system(L) and the average time a customer spends in the system(W)?
- The monthly income (in RM'000) of husbands and wives in 12 households is as below: Household 1 2 3 4 5 6 7 8 9 10 11 12 Husband 2.5 4.7 3.5 7.6 10.6 4.7 5.6 12.7 15.6 4.5 5.5 12.5 Wife 2.6 4.0 4.0 7.9 5.8 1.6 6.0 3.0 15.8 4.5 6.5 8.5 State your hypotheses. Test if there is a difference in income between the husbands and wives in the 12 households at 0.05 significant level.In 42 of the 64 years from 1950 through 2014,the S& P 500 finished higher after the first five days of trading (in 2011 there was virtually no change). In 37 out of 42 years, the S&P 500 finished higher for the year. Is a good first week a good omen for the upcoming year? The following table gives the first-week and annual performance over this 64-year period. S&P 500's Annual Performance First week Higher Lower Total Higher 37 5 42 Lower 11 11 22 Total 48 16 64 a) If a year is selected at random,what is the probability that the S&P 500 finished lower for the year? b) Given that the S&P fiished lowerr after the first five days of trading, what is the proability that it finished lower for the year? c) Are the two events "first week performance" and "annual performance" independent?In 42 of the 66 years from 1950 through 2016 (in 2011 there was virtually no change), the S&P 500 finished higher after the first five days of trading. In 37 out of 42 years, the S&P 500 finished higher for the year. Is a good first week a good omen for the upcoming year? The following table gives the first-week and annual performance over this 66-year period. First week Higher Lower Total Higher 37 5 42 Lower 12 12 24 Total 49 17 66 -what is the probability that the S&P 500 finished higher for the year? -b) Given that the S&P finished higher after the first five days of trading, what is the probability that it finished higher for the year? -c) Are the two events "first week performance" and "annual performance" independent? Expaint?