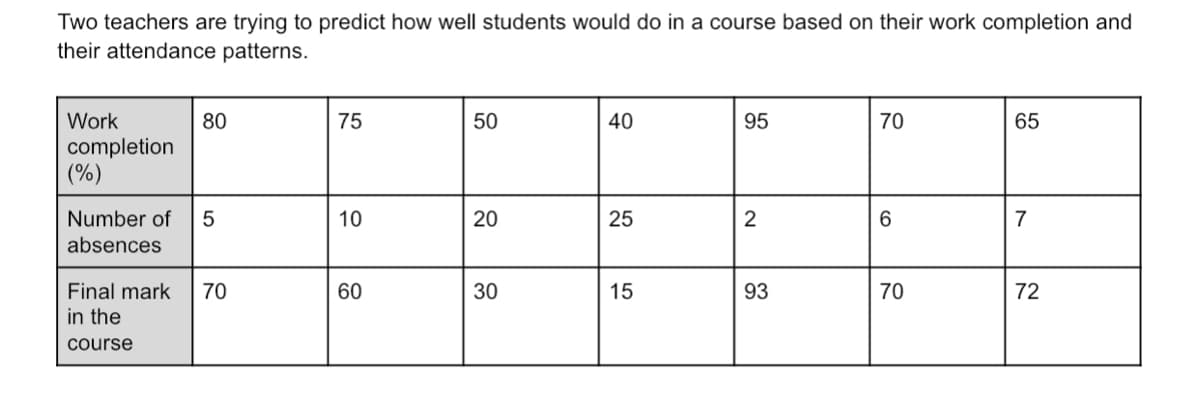
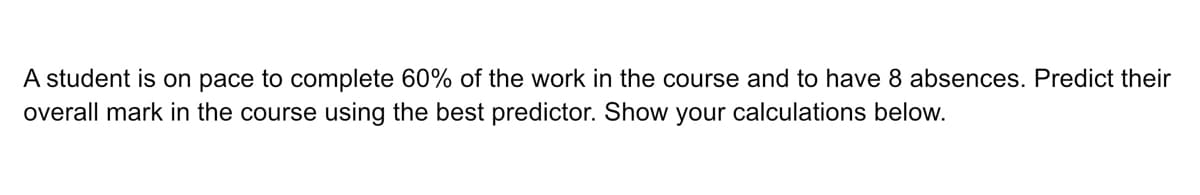
A student is on pace to complete 60% of the work in the course and to have 8 absences. Predict their overall mark in the course using the best predictor. Show your calculations below.


Q: To estimate the average number of customers entering and buying at the supermarket, the supervisor…
A: First of all point estimate for mean and vairince are calculated
Q: 2) Determine an equation that could be used to help predict the cumulative time at which the Dubai…
A: Since you have posted a question with multiple sub-parts, we will solve first three subparts for…
Q: Which of the following is FALSE regarding MAPE? Check all that apply. O A positive value means the…
A: From the given information we want to know false statement.
Q: random variable X having mean u and variance o. Choose the estimator for u which is both unbiased…
A:
Q: 1) Write a one-sentence interpretation of this plot. Also, comment on whether it is appropriate to…
A: Introduction: The boxplot, and t-test results are given in the question.
Q: Find the margin of error for the given values of c, σ, and n. c=0.95, σ=2.7, n=36
A:
Q: Chi-Squared Test A car dealer suspects that the weather of the day of the test drive has an effect…
A:
Q: A college radio station surveyed 420 incoming freshmen to see how many like classical music and how…
A: As per our guidelines we are suppose to answer only one question1)Given venn diagram is4
Q: Let (x-bar) be the mean of a random sample of size 60 drawn from a population with mean 120 and…
A:
Q: 3. The data below are those obtained for a group of 10 subjects on a choice- reaction time…
A:
Q: If a seed is planted, it has a 75% chance of growing into a healthy plant. If 8 seeds are planted,…
A:
Q: A research project by a large restaurant chain studied how many times a week an individual eats out.…
A:
Q: Example 22.9 An inspection of large sample of a product revealed a fraction defective of 0.35.…
A:
Q: Suppose x is a normally distributed random variable with p= 12 and o= 2. Find each of the following…
A:
Q: The lifespan of people with Alzheimer's disease from the onset of symptoms to the person's death…
A: Solution: Let X represent the lifespan of people with Alzheimer disease. X~N(μ=8, σ4) n= 225 Sample…
Q: The number of hours 10 students spent studying for a test and their scores on that test are shown in…
A: Hypothesis : H0 : ρ = 0 , i.e. there is a no significance linear correlation between the data H1 :…
Q: In a recent year, the scores for the reading portion of a test were normally distributed, with a…
A: Since you have posted a question with multiple sub-parts, we will solve first three sub- parts for…
Q: flip a fair coin. If it is tails I roll a four sided die (1,2,3,4) and if it is heads I roll a six…
A: Given: I flip a fair coin. If it is tails I roll a four sided die (1,2,3,4) and if it is heads I…
Q: Suppose the monthly charges for cell phone plans are normally distributed with mean μ=$62 and…
A:
Q: Which of the following is thet-value for a 95% confidence level when the sample size is 20. O a.…
A:
Q: o the emergency room of a small hospital is 2 it, on any giv wły admitted patients?
A:
Q: If x is a binomial random variable, compute p(x) for each of the cases below. a.n=5, x=1, p= 0.3 b.…
A: Since you have posted a question with multiple sub-parts, we will solve first three subparts for…
Q: An article in the IEEE Transactions on Components, Hybrids, and Manufacturing Technology (1992, Vol.…
A:
Q: random sample of 15 ECE graduates of a certain school design a schematic diagram of a given…
A:
Q: Find the slope of the line shown below -3 -2 -2- -4- slope
A: Solution-: We find the slope of the line in the given graph
Q: The regression equation for predicting a woman's muscle mass (a quantitative metric, Y) from age (in…
A: The confidence interval is a range of values used to test hypothesis.
Q: The scatter plot shows the number of CDs (in millions) that were sold from 199 to 2003, Il the rend…
A: Scatter plot is the first step of conducting linear regression analysis.
Q: Expected Values of Sums of Random Variables (1) Let the joint probability density function of random…
A:
Q: Cam The mean puise rate n beats per minue ofr adut males is equal to 686 tpm. For a random sampie of…
A: According to the given information in this question we need to identify two parts a) Mean (u) =…
Q: Question 1: A. The following table displays the number of policyholders by territory by number of…
A: Given information: Claims Territory 1 Territory 2 Territory 3 Territory 4 Total 0 97 188 392…
Q: An semicon company manufactures LED bulbs that have a length of life that is approximately normally…
A:
Q: Assume that a sample is used to estimate a population mean u. Find the margin of error M.E. that…
A:
Q: A covariance of 0.01 between data set A and data set B indicates: 1. A strong tendency for B to…
A: Covariance measures the direction of relationship between two variables.
Q: Indicate how to show the sum of independent normal random variables is a normal random variable…
A: Solution
Q: Ihe probability i | (Type an integer or a decimal. Round to four decimal places as needed.) d. What…
A:
Q: Frequency 25 Arrivals 48 40 36 23 17 7 12345678
A: The given data is Arrivals x Frequency f 0 25 1 48 2 40 3 36 4 23 5 17 6 7 7 3…
Q: Like father, like son: In 1906, the statistician Karl Pearson measured the heights of 1078 pairs of…
A:
Q: LInat are nornma distributed with a mean of 6.1-in and a standard deviation of 1.2-in. In what range…
A: Given Data : Population Mean,μ = 6.1 Population Standard Deviation,σ = 1.2
Q: An article in Fuel Processing Technology described an experiment to investigate the effect of…
A: There are 3 independent samples which are 0.6, 0.9 and 1.2 PH concentration. We have to test whether…
Q: You have read 200 of the 400 novels in your home, but your sister Roslyn has read 100, of which only…
A: Solution-: We want to find the following (a) You have read 200 of the 400 novels in your home, but…
Q: Find the area to the right of 15.09 under the x2-curve with 10 degrees of freedom. Note that this is…
A: Given; random variable x from chisquare distribution with degrees of freedom=10 Then to find area…
Q: In the space below (or on a separate sheet of paper), plot all observations of the table above and…
A: Steps to plot of the data and regression line using Excel is obtained as follows: Enter the data in…
Q: each case, determine the two variables and tell Wheth the relationship is positive or negative. a.…
A: Comment: As per the our company guidelines we are supposed to answer only three subparts. Kindly…
Q: Eric is taller than Annie, but he is smaller than Raul. If E - Eric's height, A - Annie's height and…
A: Here, E-Eric A-Annie R-Raul Eric is taller than Annie, but he is smaller than Raul. Then,…
Q: 9.44 Vegetarians' Weights The mean weight of all 20-ycar- old worhen is 128 pounds…
A: a. Assume that μ is the population mean weight of all 20-year-old women.
Q: Range = Standard Deviation =
A: here given data 24 children , n =24
Q: A national standard requires that public bridges over 20 feet in length must be inspected and rated…
A:
Q: ) Use your regression equation to predict the height of an eruption if it has been 15 hours since…
A: Given that, random sample of 11 of the geyser's eruptions and for each the time since the last…
Q: 9. Find the minimum sample size needed to be within a margin of error of 2% of the population…
A: We have given that, Margin of error (E) = 2% = 0.02 and confidence level = 90% Then, We will find…
Q: pose that data are obtained from 20 pairs of (x, y) and the sample correlation coefficient is 0.76.…
A:

Step by step
Solved in 2 steps with 3 images

- If you played the game in Exercise 1 many times, then you would expect your average payoff per game lo be about $ ____________.the american association of individual investors conducts a weekly survey of its members to measure the percent who are bullish, bearish, and neutral on the stock market for thenext six months. for the week ending november 7, 2012, the survey results showed 38.5%bullish, 21.6% neutral, and 39.9% bearish (aaii website, november 12, 2012). assumethese results are based on a sample of 300 aaii members.a. over the long term, the proportion of bullish aaii members is .39. conduct a hypothesis test at the 5% level of significance to see if the current sample results show thatbullish sentiment differs from its long term average of .39. what are your findings?the american association of individual investors conducts a weekly survey of its members to measure the percent who are bullish, bearish, and neutral on the stock market for thenext six months. for the week ending november 7, 2012, the survey results showed 38.5%bullish, 21.6% neutral, and 39.9% bearish (aaii website, november 12, 2012). assumethese results are based on a sample of 300 aaii members.a. over the long term, the proportion of bullish aaii members is .39. conduct a hypothesis test at the 5% level of significance to see if the current sample results show thatbullish sentiment differs from its long term average of .39. what are your findings?b. over the long term, the proportion of bearish aaii members is .30. conduct a hypothesis test at the 1% level of significance to see if the current sample results show thatbearish sentiment is above its long term average of .30. what are your findings?
- the american association of individual investors conducts a weekly survey of its members to measure the percent who are bullish, bearish, and neutral on the stock market for thenext six months. for the week ending november 7, 2012, the survey results showed 38.5%bullish, 21.6% neutral, and 39.9% bearish (aaii website, november 12, 2012). assumethese results are based on a sample of 300 aaii members.a. over the long term, the proportion of bullish aaii members is .39. conduct a hypothesis test at the 5% level of significance to see if the current sample results show thatbullish sentiment differs from its long term average of .39. what are your findings?b. over the long term, the proportion of bearish aaii members is .30. conduct a hypothesis test at the 1% level of significance to see if the current sample results show thatbearish sentiment is above its long term average of .30. what are your findings?c. would you feel comfortable extending these results to all investors? why or why…you are analyzing the variables that explain the returns on the stock of the Boeing Com- pany. Because overall market returns are likely to explain a part of the returns on Boeing, you decide to include the returns on a value-weighted index of all the companies listed on the nySe, aMeX, and naSdaQ as an independent variable. Further, because Boeing is a large company, you also decide to include the returns on the S&P 500 index, which is a value-weighted index of the larger market-capitalization companies. Finally, you decide to include the changes in the uS dollar’s value. to conduct your test, you have collected the following data for the period 1990–2002. Rt = monthly return on the stock of Boeing in month t RALLt = monthly return on a value-weighted index of all the companies listed on the nySe, aMeX, and naSdaQ in month t RSPt = monthly return on the S&P 500 index in month t ΔXt = change in month t in the log of a trade-weighted index of the foreign exchange value of the uS…A school district started using a new criteria for selecting which students entered their "accelerated" math track, starting in 6th grade. The study found that under the new criteria about 75% of the students in the district were eligible for accelerated math in 6th grade, but that from one year to the next only about 2/3 of the students stayed in the accelerated track. a) Assuming that everyone who is eligible enrolls the first year, make a TABLE that shows the percent of the students in the district that would be expected to be enrolled in the accelerated track each year from 6th grade until 10th grade. Please show the work you used to fill in your table. b) Considering that from one year to the next about 2/3 of the students stay in the accelerated track, is there a grade level in which you'd expect about 1/10 as many students in the accelerated track as there were in 6th grade? Does the number of students in the accelerated track in 6th grade affect your answer? Please show your…
- For the past years, 20% of the babies were delivered through cesarean section. The research group randomly inspects the medical records of 144 births and finds that 25 of births were by cesarean section. Can the researcher group conclude that the percent of births by cesarean section has decreased at 5% level of significance?Suppose two households earn $40,000 and $56,000 respectively. What is the expected percent difference in wages between the children, grandchildren, and great-grandchildren of the two households if the intergenerational correlation of earnings is 0.2, 0.4, or 0.6?Suppose that in the previous semester, the percentages of students in the five sections of ECO 204 were 20%, 21%, 19%, 15% and 25%. However, in the current semester, among a sample of 200 students, the student distribution among five sections is 51, 49, 30, 20 and 50. Can we conclude that there has been a statistically significant change in the student proportions?
- Jane White has recorded the following sales figures for last year for herbusiness: January, $35,645; February, $35,456; March, $31,270; April,$32,129; May, $34,456; June, $35,256; July, $36,218; August, $35,456;September, $34,250; October, $32,156; November, $30,125; December,$32,275. She wants to select from one of three models: a 3-month movingaverage, a weighted moving average (she believes that the weightsshould be 0.2, 0.3, and 0.5), and an exponential smoothing average inwhich she uses an α of 0.2 and an assumed forecast for January of Year 1of $35,000.a. Construct a table that shows each of these forecasts for the current year andprovide the forecast for January of Year 2.b. Using the available data and your forecasts, which model do you suggest thatJane use for her business?Show all your work. Indicate clearly the methods you use, because you will be scored on the correctness of your methods as well as on the accuracy and completeness of your results and explanations. At a financial institution, a fraud detection system identifies suspicious transactions and sends them to a specialist for review. The specialist reviews the transaction, the customer profile, and past history. If there is sufficient evidence of fraud, the transaction is blocked. Based on past history, the specialist blocks 40 percent of the suspicious transactions. Assume a suspicious transaction is independent of other suspicious transactions. (a) Suppose the specialist will review 136 suspicious transactions in one day. What is the expected number of blocked transactions by the specialist? Show your work. (b) Suppose the specialist wants to know the number of suspicious transactions that will need to be reviewed until reaching the first transaction that will be…Most engaged couples expect or at least hope that they will have high levels of marital satisfaction. However, because 54% of first marriages end in divorce, social scientists have begun investigating influences on marital satisfaction. Suppose a clinical psychologist sets out to look at the role of economic hardship in relationship longevity. She decides to measure marital satisfaction in a group of couples living above the poverty level and a group of couples living below the poverty level. She chooses the Marital Satisfaction Inventory, because it refers to “partner” and “relationship” rather than “spouse” and “marriage,” which makes it useful for research with both traditional and nontraditional couples. Higher scores on the Marital Satisfaction Inventory indicate greater satisfaction. There is one score per couple. Assume that these scores are normally distributed and that the variances of the scores are the same among couples living above the poverty level as among couples…

