A student was asked to find a 99% confidence interval for the population proportion of students who take notes using data from a random sample of sizen = 75. Which of the following is a correct interpretation of the interval 0.1 < p < 0.27? Check all that are correct. The proprtion of all students who take notes is between 0.1 and 0.27, 99% of the time. With 99% confidence, a randomly selected student takes notes in a proportion of their classes that is between 0.1 and 0.27. With 99% confidence, the proportion of all students who take notes is between 0.1 and 0.27. |There is a 99% chance that the proportion of the population is between 0.1 and 0.27. There is a 99% chance that the proportion of notetakers in a sample of 75 students will be between 0.1 and 0.27.
A student was asked to find a 99% confidence interval for the population proportion of students who take notes using data from a random sample of sizen = 75. Which of the following is a correct interpretation of the interval 0.1 < p < 0.27? Check all that are correct. The proprtion of all students who take notes is between 0.1 and 0.27, 99% of the time. With 99% confidence, a randomly selected student takes notes in a proportion of their classes that is between 0.1 and 0.27. With 99% confidence, the proportion of all students who take notes is between 0.1 and 0.27. |There is a 99% chance that the proportion of the population is between 0.1 and 0.27. There is a 99% chance that the proportion of notetakers in a sample of 75 students will be between 0.1 and 0.27.

College Algebra
7th Edition
ISBN:9781305115545
Author:James Stewart, Lothar Redlin, Saleem Watson
Publisher:James Stewart, Lothar Redlin, Saleem Watson
Chapter9: Counting And Probability
Section9.3: Binomial Probability
Problem 2E: If a binomial experiment has probability p success, then the probability of failure is...

Related questions
Question
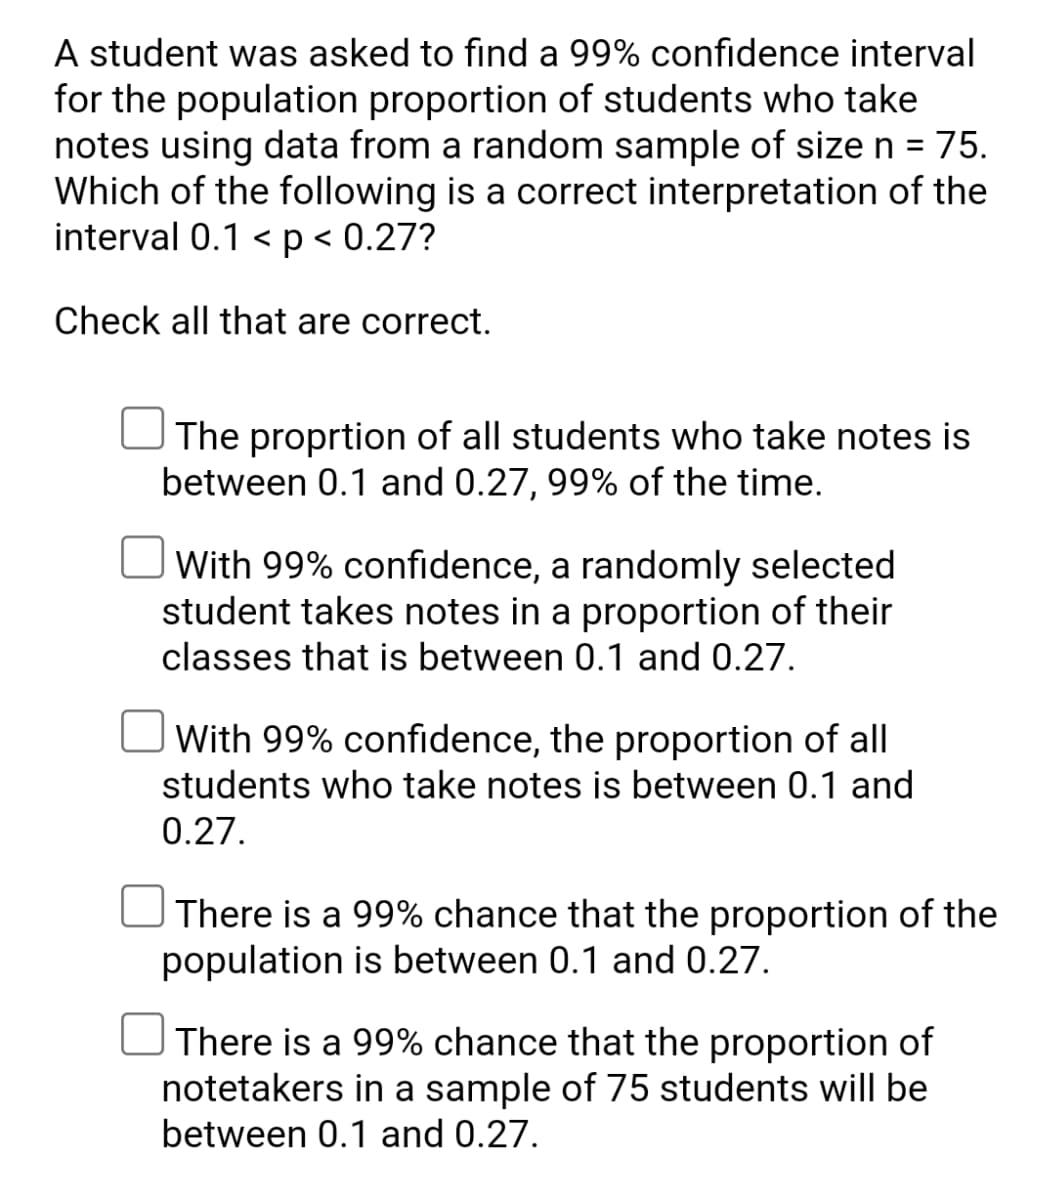
Transcribed Image Text:A student was asked to find a 99% confidence interval
for the population proportion of students who take
notes using data from a random sample of size n =
Which of the following is a correct interpretation of the
interval 0.1 < p < 0.27?
75.
Check all that are correct.
| The proprtion of all students who take notes is
between 0.1 and 0.27, 99% of the time.
With 99% confidence, a randomly selected
student takes notes in a proportion of their
classes that is between 0.1 and 0.27.
With 99% confidence, the proportion of all
students who take notes is between 0.1 and
0.27.
There is a 99% chance that the proportion of the
population is between 0.1 and 0.27.
There is a 99% chance that the proportion of
notetakers in a sample of 75 students will be
between 0.1 and 0.27.
Expert Solution
This question has been solved!
Explore an expertly crafted, step-by-step solution for a thorough understanding of key concepts.

This is a popular solution!

Trending now
This is a popular solution!

Step by step
Solved in 2 steps

Recommended textbooks for you
College Algebra
Algebra
ISBN:
9781305115545
Author:
James Stewart, Lothar Redlin, Saleem Watson
Publisher:
Cengage Learning
College Algebra
Algebra
ISBN:
9781305115545
Author:
James Stewart, Lothar Redlin, Saleem Watson
Publisher:
Cengage Learning