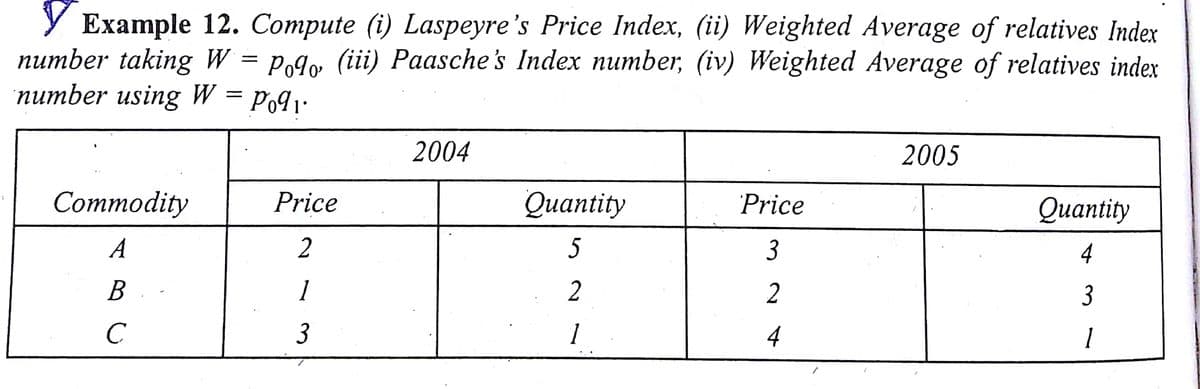
Y Example 12. Compute (i) Laspeyre's Price Index, (ii) Weighted Average of relatives Index number taking W = number using W = Po91• Po9o (iii) Paasche's Index number, (iv) Weighted Average of relatives index 2004 2005 Commodity Price Оuantity Price Оuаntity A 2 3 4 В 2 2 3 C 3 4


Q: The following data were obtained for the growth of a tarsier population introduced into a new enviro...
A: Hai
Q: By using the average of the quantities of two years as weights, compute a price index. Commodity Qua...
A:
Q: Find the correct coefficient of correlation.
A: Here use correlation coefficient formula
Q: You flip a fair coin 10 times. What is the probability that it lands on heads exactly 5 times? proba...
A: From the given information we find the probability.
Q: A pair of unbiased dice is thrown. Find the probability that (i) the sum of spots is either 5 or 10,...
A: The sample space is S={ (1,1) (1,2) (1,3) (1,4) (1,5) (1,6) (2,1) (2,2) (2,3) (2,4) (2,5) (2,6) (3...
Q: A random sample of 80 eighth grade students' scores on a national mathematics assessment test has a ...
A:
Q: What is the optimal time for a scuba diver to be on the bottom of the ocean? That depends on the dep...
A: Comment: As per the our company guidelines we are supposed to answer only three subparts. Kindly rep...
Q: Calculate Median and Arithmetic Mean from the following series: 5 men get less than 12 men get less ...
A: Given : Class cumulative frequency 0-5000 5 5000-10000 12 10000-15000 22 15000-20000 30 ...
Q: Show: Step 1: State the hypothesis Step 2: The level of significance, degree of freedom and critical...
A: Population mean = 45 minutes Sample mean = 50 minutes N=28 Standard deviation deviation = 6 minutes ...
Q: Example 13. Compute Fisher's Ideal quantity index number from the following data: Соmmodivy 2004 200...
A:
Q: Example 17. From the following data, construct an index number with 2000 as base. 2000 2001 2002 200...
A:
Q: Approximately _% of the area under the normal curve is between u- o and u+ o. 95 68 50 99.7 O O O O
A:
Q: Illustration 14.6. Extrapolate the cost of living index for 1972 from the following data: Year Cost ...
A:
Q: . Convert the following fixed base index numbers into chain base index numbers.
A: Firstly it is required to calculate the link relatives for each index number as L.R = (current year ...
Q: There are two groups of subjects one of which consists of 5 science subjects and 3 engineering subje...
A:
Q: Suppose Y1, Y2, ·…,Yn is an iid sample from a N(µ, ở) population distribution. Let Y and S? denote t...
A: Find the distribution of Q12+Q2
Q: Suppose that the waiting time for a college campus shuttle is uniformly distributed between 8 and 28...
A: Given : x follows uniformly distributed between 8 and 28 minutes. a = 8b =28 Worst 15% of all waitin...
Q: 2. From a business class of 16 equally capable students using programmed materials, 5 are selected a...
A:
Q: A population consist of the five numbers 2,3,6,8, and 11. Consider samples of size 2 that can be dra...
A: A population consist of the five numbers 2,3,6,8, and 11. Consider samples of size 2 that can be dra...
Q: The following data present the yields in quintals of common ten subdivisions of equal area of two ag...
A:
Q: The random-number generator on calculators randomly generates a number between 0 and 1. The random v...
A:
Q: how did you get 200000/1500 to equal 31, im not getting that
A: Given data: 200000/1500
Q: Use technology to find the P-value for the hypothesis test described below. The claim is that for 12...
A: It is given that Sample size n = 3 Test statistic t = 1.732 Test : right-tailed
Q: Q1 Suppose the scores, X, on a college entrance examination is normally distributed with mean 550 an...
A:
Q: Given the frequency distribution of biood sugar leves of 30 sample employees, answer the folowing qu...
A: Given data is Blood sugar level Frequency 61-69 2 71-79 6 81-89 8 91-99 12 101-109 2
Q: The following tables about student scores in Physics and Statistics # OF STUDENTS PHYSICS STATISTICS...
A: Data is given for number of students for the scores of stastics and physics We have to calculate mea...
Q: 15. Twenty seeds were sown in each of 100 trays and the number of seeds that germinated was recorded...
A: For the given data Find (a) compute mean =?median =? mode =? (b) which would be best average ?
Q: Female Prison Inmates Seventy-four percent of female prison inmates are mothers. If 3 female prison ...
A:
Q: The number of pets owned by twelve randomly chosen students are 0, 0, 1, 3, 14, 1, 2, 2, 0, 1, 2, 1...
A:
Q: "Given a standard normal distribution with mean =114 and standard deviation = 26, find P(75 <X < 115...
A:
Q: The number of pets owned by twelve randomly chosen students are 0, 0, 1, 3, 14, 1, 2, 2, 0, 1, 2, 1...
A: First Quartile: It is the median of lower half data. Lower half data means the data values which are...
Q: The heights of NBA players are normally distributed, with an average height of 6'7" (i.e. 79 inches)...
A:
Q: "Given a standard normal distribution with mean =84 and standard deviation = 37, find P(X<119)." 0.6...
A:
Q: In a police training exercise twelve new recruits are to break into six pairs for physical skill dri...
A:
Q: Bloomberg Intelligence listed 50 companies to watch in 2018 (www.bloomberg.com/features/companies-to...
A: a. Draw a scatter diagram. b. Compute the correlation coefficient. c. Determine the regression equa...
Q: A famous Chinese restaurant would like to find out the change in demand on its dim-sum. After checki...
A:
Q: The organizers of a conference want to survey attendees about the registration fee. Which of the fol...
A: Cluster Sampling : Cluster sampling may be a technique within which researchers divide a population ...
Q: give a broad conclusion about learning sampling technique and its importance.
A: Sampling is a method that allows researchers to get information about the population based on the st...
Q: In a random sample of six mobile devices, the mean repair cost was $65.00 and the standard deviati...
A:
Q: Try Again Your answer is incorrect. • Some of the frequencies are incorrect. The following is a list...
A:
Q: Total 12-Month Total 12-Month Assests Sales Assests Sales Company ($ Billions) ($ Billions) Company ...
A: Since you have posted a question with multiple sub-parts, we will solve first three subparts for you...
Q: Days Sick Monday 365 Tuesday 270 Wednesday 300 Thursday 300 Friday 335 The Director...
A: Chi square χ2 goodness of fit test only can be used, if you are interested to find the comparison be...
Q: "The weights of 1,000 children, in average, is 53kg with standard deviation of 11kg. Suppose the wei...
A:
Q: (b) Applying the MSE measure of forecast accuracy, would you prefer a smoothing constant of a = 0.1 ...
A: Data is given for time series value according to weeks. We have to calculate MSE, MAE, MAPE
Q: Consider the following time series data. Week 1 3 Value 19 12 17 10 18 15 Using the naive method (mo...
A:
Q: llustration 13.26 Calculate the cost of living index. Item Quanțity used in given year Po Pa 1. Rice...
A:
Q: cuļate the real income takihg into account the rise in the cost of living. Year Cost of living 1949 ...
A:
Q: Given the following frequencies of the positive class, find the frequencies of the rest of the class...
A: The letters A,B,C are indicates the presences of Attribute while, the α, β, γ are indicating the abs...
Q: 12.54 John Swanson, president of Market Research Inc., has asked you to estimate the coefficients of...
A:
Q: An electrical firm manufactures light bulbs that have a length of life that is normally distributed ...
A:


Trending now
This is a popular solution!

Step by step
Solved in 2 steps with 2 images

- Attack rate for influenza by age andtreatment group age QIV group Control group 3-4 3.78% 5.69% 5-8 1.70% 0.15% Suppose that 80% of 3–4-year-old children and 70% of 5–8-year-old children in a village are vaccinated with QIV vaccine. Also assume that children who are not vaccinated have twice the incidence of influenza as the control group in Table. What % of 3–4-year-old children in the village will get influenza? (Hint: Use the law of total probability. P(B)=P(B|A1) x P(A1) + P(B|A2) x P(A2) ) What % of 5–8-year-old children in the village will get influenza? (Hint: Use the law of total probability. P(B)=P(B|A1) x P(A1) + P(B|A2) x P(A2) )The data in the table characterizes the income distribution for a country. Income category Share of income (%) Cumulative share of income (%) first quintile 7.0 --- second quintile 9.0 16.0 third quintile --- 37.0 fourth quintile 25.0 --- fifth quintile 38.038.0 --- What percentage of the total population is categorized as belonging to the second quintile? Give your responses as whole numbers. Percentage of population in second quintile:__________% What percentage of the total income for the country is earned by the third quintile? Percentage earned by the third quintile:__________% What is the cumulative share of income earned by the poorest 80% of the population? Percentage earned by the poorest 80%:__________%Q3 - Returns on stocks X and Y are listed below: Period 1 2 3 4 5 6 7Stock X 3% -2% 9% 6% -1% -4% 11%Stock Y 1% -4% 7% 12% 3% -2% -1% Consider a portfolio of 20% stock X and 80% stock Y. What is the (population) variance of portfolio returns? Please round your answer to six decimal places.
- Engro group, who recently sold its Engro foods start-up for a multi-million-rupees sum, is looking for another investment for fresh capital. It is considering an investment in coal (X) and solar (Y) power plant. For that they had a collected data on 5 different characteristics. Amanda has applied k-means clustering to this data for k = 2. Given the following data: Table 5.1 Observations X Y 1 20 18 2 8 20 3 36 26 4 22 12 5 14 4 Visually represent the clusters of both partsEngro group, who recently sold its Engro foods start-up for a multi-million-rupees sum, islooking for another investment for fresh capital. It is considering an investment in coal (X) andsolar (Y) power plant. For that they had a collected data on 5 different characteristics. Amandahas applied k-means clustering to this data for k = 2. Given the following data:Table 5.1 Observations X Y 1 20 18 2 8 20 3 36 26 4 22 12 5 14 4 a) Which value of k is the most appropriate to categorize these investments? Justify yourchoice with calculations.b) The two cluster centers after the first round of execution. c) The final two clusters. d) Visually represent the clusters of both parts (b) and (c).The diversifiable risk of a portfolio:a. Is correlated with systematic risk.b. Can be made sufficiently small.c. Is zero in the real world.d. Is the risk that investors lose because of transaction costs.
- An economist was interested in the relation between the disposable income of a family and the amount of money used for food per month. He did a preliminary study on eight randomly selected lower income families. (Each family was of the same size; father, mother and two children). The economist’s data are given in the table below. Food cost (Y) (in hundreds of rand) 55 60 42 40 37 26 39 43 Family disposable income(X) (in hundreds of rand) 30 36 27 20 16 24 19 25 Find the regression linear equation. What is the predicted food cost if the family disposable income is R1800 Find the correlation coefficient & Interpret r. Find the Coefficient of Determination & Interpret the R2.Here are 3 boxplots of weekly gas prices at a service station in the United States (price in $ per gallon). Compare the distribution of prices over the three years. Choose the best answer below: A. Gas price have been increasing on average over the 3-year period, but the spread has been decreasing. The distribution has been skewed to the left, and there were 3 high outliers in 2005. B. Gas price have been increasing on average over the 3-year period, and the spread has been increasing as well. The distribution has been skewed to the left, and there were 3 high outliers in 2005. C. Gas price have been increasing on average over the 3-year period, and the spread has been increasing as well. The distribution has been skewed to the right, and there were 3 high outliers in 2005. D. Gas price have been decreasing on average over the 3-year period, and the spread has been decreasing. The distribution has been skewed to the left, and there were 3 high outliers in 2005. E. Gas…Shah Rukh Khan is studying companies going public for the first time. He is particularly interested in the relationship between the size of the offering and the price per share. A sample of 15 companies that recently went public revealed the following information. Company Size ($ millions), X Price per Share, Y 1 9.0 10.8 2 94.4 11.3 3 27.3 11.2 4 179.2 11.1 5 71.9 11.1 6 97.9 11.2 7 93.5 11.0 8 70.0 10.7 9 160.7 11.3 10 96.5 10.6 11 83.0 10.5 12 23.5 10.3 13 58.7 10.7 14 93.8 11.0 15 34.4 10.8 Is the relationship between the size of the offering and the price per share significant, if the level of significance is 2.5%? What is the coefficient of determination? The coefficient of determination is_________ ; The relationship between the size of the offering and the price per share is For coefficient of determination, leave your answer in 3 decimal…
- Intergarated products Need to estimate its pc sales for the nextnext year. the most recent six years of revenue data for the companys line of xt personal computers and those of the industry, is found in the table below; Year XT PC Sales (000,000) All Industry PC Sales Revenue 1 2.4 4.6 2 5.9 8.6 3 15.5 10.7 4 27.8 14.8 5 35.9 18.5 6 38.1 19.4 a) Assuming that the sales data above are representative of sales expected next year , use time series regression analysis to forecast next years sales b) determine the correlation correlation for he ime forecast and interpret is meaning c) find the coefficient of determination for the time series forecast and intpret it s meaning d) perform a regression analysis between the annual sales revenues of XT Personal computers and all personal computers if the estimate of next years industry PC sales revenues is $21.9 billion? e) which independent variable should intergrated products coporation IPC choose for its forcasting of sales…1. OPER Health Center is rightfully worried about the need for additional physicians to cope with the increased patient flow. To see what the implications of increased flows would be, let us first investigate whether physicians are assigned efficiently in the current setting. Consider a typical day. The average numbers of patient arrivals to the health center during different times are shown in the following table. Time Slot Average Number of Patients # of physicans per hour 9-11am 32 9 11-1 pm 1-3 pm 20 23 10 9 3-5 pm 15 8 Coefficient of variation for the patient interarrival times is 1.4 and coefficient of variation for the activity times is 2. a) Compute the average waiting time to see a doctor for each time slot. (Remember that only 80% of patients visit the physicians). b) Suppose that the objective of BCG is to ensure that the average waiting time of a patient to see a physician is less than 25 minutes throughout the day (i.e., in each time slot) Develop a…2. A scatterplot shows a strong, positive, linear relationship between the number of rebounds a basketball team averages and the number of wins that team records in a season. Which conclusion is most appropriate? (A) A team that increases its number of rebounds causes its chances of winning more games to increase. (B) If the residual plot shows no pattern, then it is safe to conclude that getting more rebounds causes more wins, on average. (C) If the residual plot shows no pattern, then it is safe to conclude that getting more wins causes more rebounds, on average. (D) If the r^2r2 value is close enough to 100%, then it is safe to conclude that getting more rebounds causes more wins, on average. (E) Rebounds and wins are positively correlated, but we cannot conclude that getting more rebounds causes more wins, on average.


