A study compared the LPO between obesity group and normal group, Table LPO between obesity group and normal group Group Mean of LPO n 0.6 Normal 7.58 30 4 0.8 Obesity 9.36 30 3 ( 6. Which statistical test should be used in this example? A. Two independent samples t-test. C. One sample ttest ( )7. Which is the null hypothesis of this example? B. Paired ttest. D. McNemar test. A. 0,=02 B. D,#02 C. Dg=0 D. Og#0 ( ) 8.Which is the dfof this example? A. 60 В.58 С.59 D.1 ( ) 9. Which is the pvalue if the test value of this data is 9.3021 and the critical value is 2.002 A. p>0.05 В. р<0.05 C. 0
A study compared the LPO between obesity group and normal group, Table LPO between obesity group and normal group Group Mean of LPO n 0.6 Normal 7.58 30 4 0.8 Obesity 9.36 30 3 ( 6. Which statistical test should be used in this example? A. Two independent samples t-test. C. One sample ttest ( )7. Which is the null hypothesis of this example? B. Paired ttest. D. McNemar test. A. 0,=02 B. D,#02 C. Dg=0 D. Og#0 ( ) 8.Which is the dfof this example? A. 60 В.58 С.59 D.1 ( ) 9. Which is the pvalue if the test value of this data is 9.3021 and the critical value is 2.002 A. p>0.05 В. р<0.05 C. 0

Holt Mcdougal Larson Pre-algebra: Student Edition 2012
1st Edition
ISBN:9780547587776
Author:HOLT MCDOUGAL
Publisher:HOLT MCDOUGAL
Chapter11: Data Analysis And Probability
Section: Chapter Questions
Problem 8CR

Related questions
Question
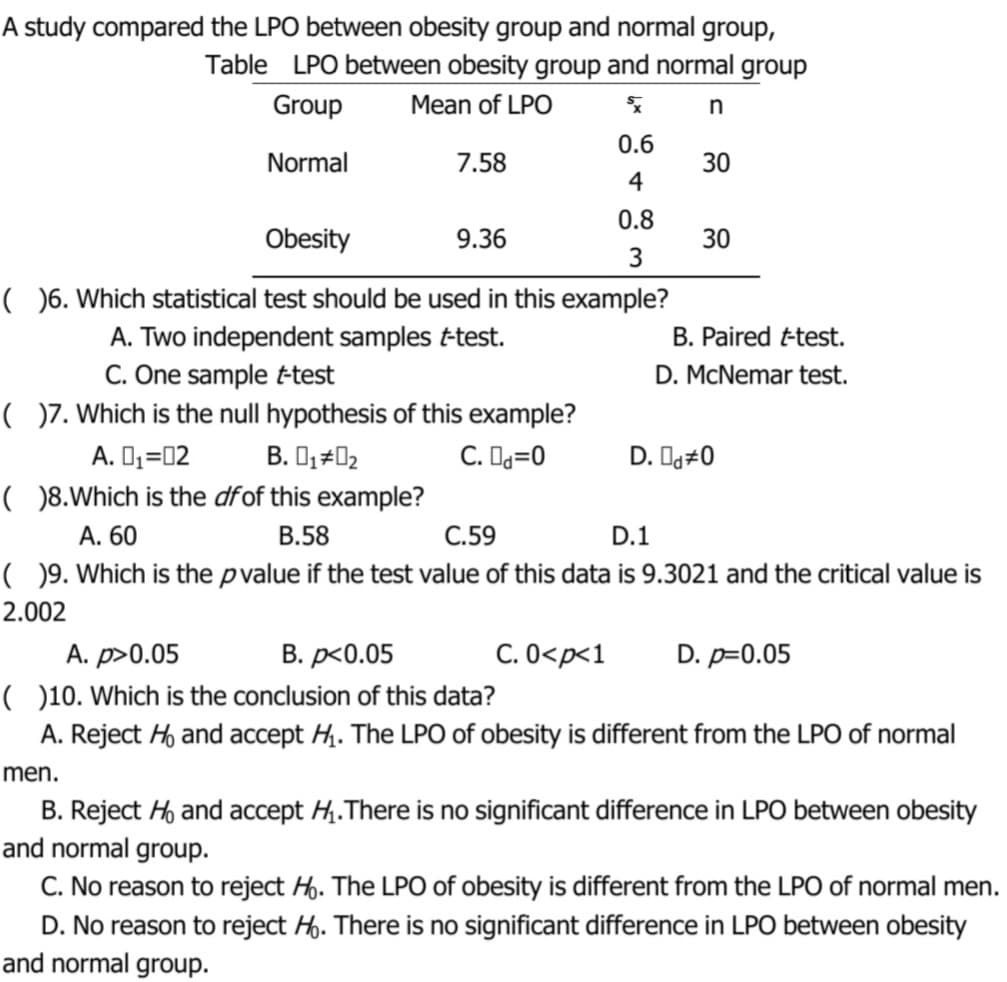
Transcribed Image Text:A study compared the LPO between obesity group and normal group,
Table LPO between obesity group and normal group
Group
Mean of LPO
n
0.6
Normal
7.58
30
4
0.8
Obesity
9.36
30
3
6. Which statistical test should be used in this example?
A. Two independent samples ttest.
B. Paired ttest.
C. One sample t-test
( )7. Which is the null hypothesis of this example?
D. McNemar test.
A. O;=02
B. D,#02
C. Og=0
D. Og#0
( )8.Which is the dfof this example?
А. 60
В.58
С.59
D.1
( ) 9. Which is the pvalue if the test value of this data is 9.3021 and the critical value is
2.002
В. р<0.05
С. 0<р<1
A. p>0.05
( ) 10. Which is the conclusion of this data?
A. Reject H, and accept H. The LPO of obesity is different from the LPO of normal
D. p=0.05
men.
B. Reject H and accept H..There is no significant difference in LPO between obesity
and normal group.
C. No reason to reject H. The LPO of obesity is different from the LPO of normal men.
D. No reason to reject H. There is no significant difference in LPO between obesity
and normal group.
Expert Solution
This question has been solved!
Explore an expertly crafted, step-by-step solution for a thorough understanding of key concepts.

Step by step
Solved in 2 steps with 1 images

Recommended textbooks for you
Holt Mcdougal Larson Pre-algebra: Student Edition…
Algebra
ISBN:
9780547587776
Author:
HOLT MCDOUGAL
Publisher:
HOLT MCDOUGAL
Holt Mcdougal Larson Pre-algebra: Student Edition…
Algebra
ISBN:
9780547587776
Author:
HOLT MCDOUGAL
Publisher:
HOLT MCDOUGAL