A study conducted by the research institute of America has concluded that the mean number of hours a person spends in their car during a typical week in 1999 15 hours. Given that times have changed in the past 20 years in terms of employment rates and public transit, it is reasonable to believe people spend more or less time in their car every week. Because we can see it going either way, we want to test the null hypothesis that the people spend 15 hours in their car against our alternative hypothesis that people spend a different amount of time in the car in 2019 compared to 1999.
A study conducted by the research institute of America has concluded that the mean number of hours a person spends in their car during a typical week in 1999 15 hours. Given that times have changed in the past 20 years in terms of employment rates and public transit, it is reasonable to believe people spend more or less time in their car every week. Because we can see it going either way, we want to test the null hypothesis that the people spend 15 hours in their car against our alternative hypothesis that people spend a different amount of time in the car in 2019 compared to 1999.

MATLAB: An Introduction with Applications
6th Edition
ISBN:9781119256830
Author:Amos Gilat
Publisher:Amos Gilat
Chapter1: Starting With Matlab
Section: Chapter Questions
Problem 1P

Related questions
Question
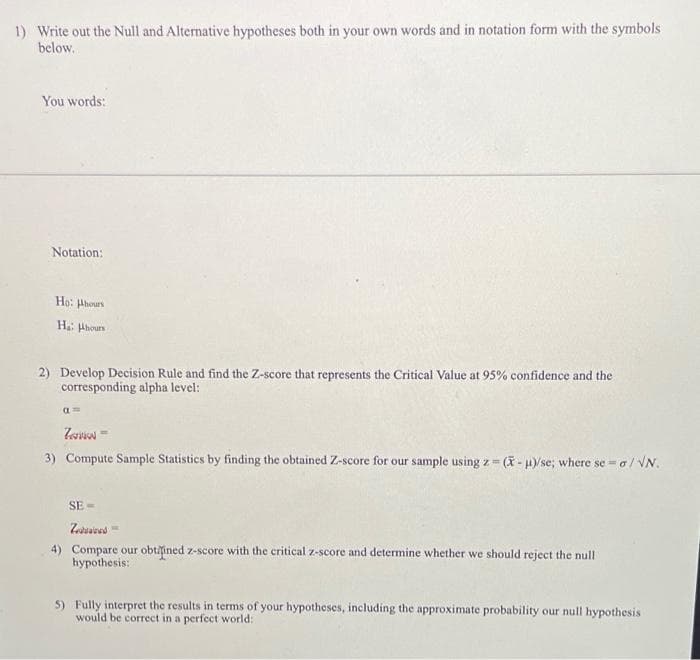
Transcribed Image Text:1) Write out the Null and Alternative hypotheses both in your own words and in notation form with the symbols
below.
You words:
Notation:
Ho: Hhours
H hours
2) Develop Decision Rule and find the Z-score that represents the Critical Value at 95% confidence and the
corresponding alpha level:
3) Compute Sample Statistics by finding the obtained Z-score for our sample using z = (X - )/se; where se =o/ VN.
SE -
Zetuiced -
4) Compare our obtiined z-score with the critical z-score and determine whether we should reject the null
hypothesis:
5) Fully interpret the results in terms of your hypotheses, including the approximate probability our null hypothesis
would be correct in a perfect world:
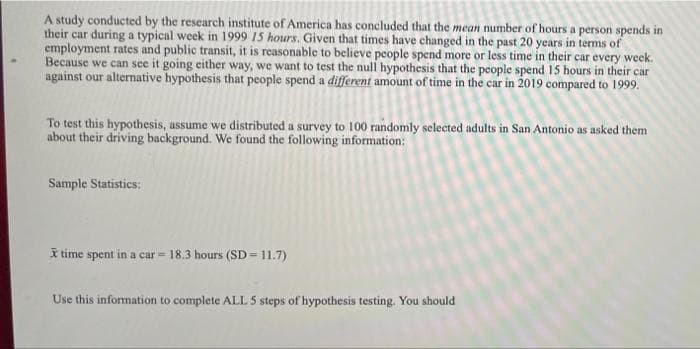
Transcribed Image Text:A study conducted by the research institute of America has concluded that the mean number of hours a person spends in
their car during a typical week in 1999 I5 hours. Given that times have changed in the past 20 years in terms of
employment rates and public transit, it is reasonable to believe people spend more or less time in their car every week.
Because we can see it going either way, we want to test the null hypothesis that the people spend 15 hours in their car
against our alternative hypothesis that people spend a different amount of time in the car in 2019 compared to 1999.
To test this hypothesis, assume we distributed a survey to 100 randomly selected adults in San Antonio as asked them
about their driving background. We found the following information:
Sample Statistics:
I time spent in a car = 18.3 hours (SD = 11.7)
Use this information to complete ALL 5 steps of hypothesis testing. You should
Expert Solution
This question has been solved!
Explore an expertly crafted, step-by-step solution for a thorough understanding of key concepts.

This is a popular solution!

Trending now
This is a popular solution!

Step by step
Solved in 2 steps

Recommended textbooks for you
MATLAB: An Introduction with Applications
Statistics
ISBN:
9781119256830
Author:
Amos Gilat
Publisher:
John Wiley & Sons Inc

Probability and Statistics for Engineering and th…
Statistics
ISBN:
9781305251809
Author:
Jay L. Devore
Publisher:
Cengage Learning

Statistics for The Behavioral Sciences (MindTap C…
Statistics
ISBN:
9781305504912
Author:
Frederick J Gravetter, Larry B. Wallnau
Publisher:
Cengage Learning
MATLAB: An Introduction with Applications
Statistics
ISBN:
9781119256830
Author:
Amos Gilat
Publisher:
John Wiley & Sons Inc
Probability and Statistics for Engineering and th…
Statistics
ISBN:
9781305251809
Author:
Jay L. Devore
Publisher:
Cengage Learning
Statistics for The Behavioral Sciences (MindTap C…
Statistics
ISBN:
9781305504912
Author:
Frederick J Gravetter, Larry B. Wallnau
Publisher:
Cengage Learning

Elementary Statistics: Picturing the World (7th E…
Statistics
ISBN:
9780134683416
Author:
Ron Larson, Betsy Farber
Publisher:
PEARSON

The Basic Practice of Statistics
Statistics
ISBN:
9781319042578
Author:
David S. Moore, William I. Notz, Michael A. Fligner
Publisher:
W. H. Freeman

Introduction to the Practice of Statistics
Statistics
ISBN:
9781319013387
Author:
David S. Moore, George P. McCabe, Bruce A. Craig
Publisher:
W. H. Freeman