A study is done by a community group in two neighboring colleges to determine which one graduates students with more math classes. College A samples 11 graduates. Their average is 4 math classes with a standard deviation of 1.5 math classes. College B samples 9 graduates. Their average is 3.5 math classes with a standard deviation of 0.95 math class. The community group believes that a student who graduates from college A has taken more math classes, on the average. Both populations have a normal distribution. Test at a = 0.05 significance level. Which distribution do you use to perform the test and what is P-values? What is your conclusion ? O a. t-test and P-value =0.1990, reject Ho b. t-test and P-value =0 1990 do not reiect I
A study is done by a community group in two neighboring colleges to determine which one graduates students with more math classes. College A samples 11 graduates. Their average is 4 math classes with a standard deviation of 1.5 math classes. College B samples 9 graduates. Their average is 3.5 math classes with a standard deviation of 0.95 math class. The community group believes that a student who graduates from college A has taken more math classes, on the average. Both populations have a normal distribution. Test at a = 0.05 significance level. Which distribution do you use to perform the test and what is P-values? What is your conclusion ? O a. t-test and P-value =0.1990, reject Ho b. t-test and P-value =0 1990 do not reiect I

Glencoe Algebra 1, Student Edition, 9780079039897, 0079039898, 2018
18th Edition
ISBN:9780079039897
Author:Carter
Publisher:Carter
Chapter10: Statistics
Section10.4: Distributions Of Data
Problem 19PFA

Related questions
Topic Video
Question
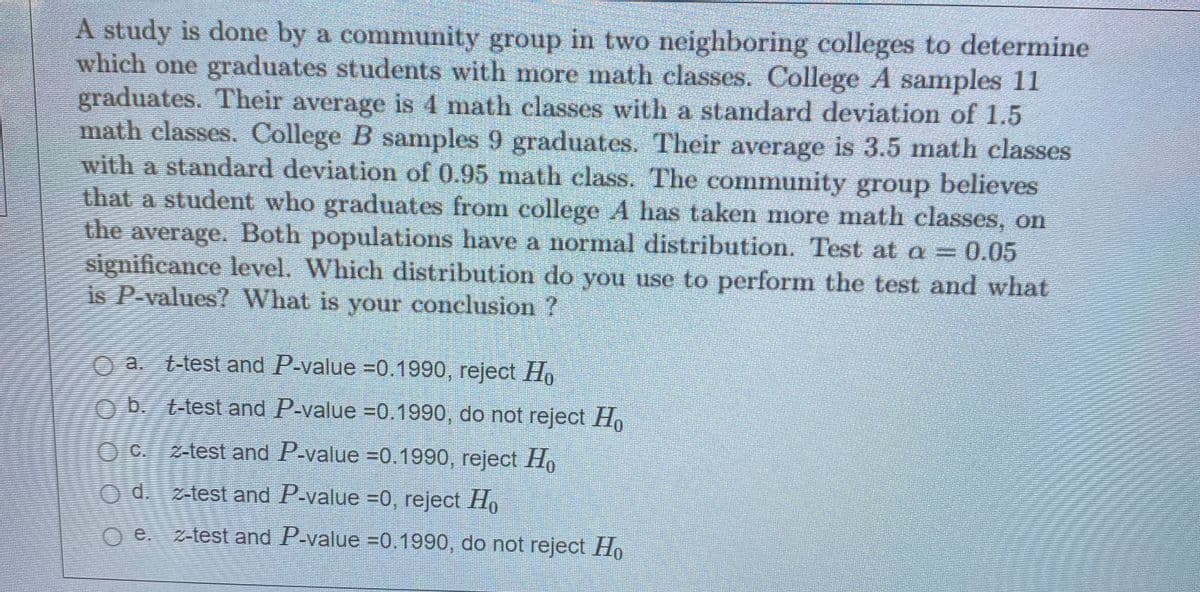
Transcribed Image Text:A study is done by a community group in two neighboring colleges to determine
which one graduates students with more math classes. College A samples 11
graduates. Their average is 4 math classes with a standard deviation of 1.5
math classes. College B samples 9 graduates. Their average is 3.5 math classes
with a standard deviation of 0.95 math class. The community group believes
that a student who graduates from college A has taken more math classes, on
the average. Both populations have a normal distribution. Test at a =
significance level. Which distribution do you use to perform the test and what
is P-values? What is your conclusion ?
O a. t-test and P-value =0.1990, reject H
O b. t-test and P-value =0.1990, do not reject Ho
O C. z-test and P-value =0.1990, reject H.
O d. z-test and P-value =0, reject Ho
e.
z-test and P-value =0.1990, do not reject Ho
Expert Solution
This question has been solved!
Explore an expertly crafted, step-by-step solution for a thorough understanding of key concepts.

This is a popular solution!

Trending now
This is a popular solution!

Step by step
Solved in 2 steps

Knowledge Booster


Learn more about
Need a deep-dive on the concept behind this application? Look no further. Learn more about this topic, statistics and related others by exploring similar questions and additional content below.Recommended textbooks for you
Glencoe Algebra 1, Student Edition, 9780079039897…
Algebra
ISBN:
9780079039897
Author:
Carter
Publisher:
McGraw Hill
Glencoe Algebra 1, Student Edition, 9780079039897…
Algebra
ISBN:
9780079039897
Author:
Carter
Publisher:
McGraw Hill