A study is done to determine if students in the California state university system take longer to graduate, on average, than students enrolled in private universities. One hundred students from both the California state university system and private universities are surveyed. Suppose that from years of research, it is known that the population standard deviations are 1.5181 years and 1 year, respectively The following data are collected. The California state university system students took on average 4.5 years with a standard deviation of 0.6. The private university students took on average 4.1 years with a standard deviation of 0.3. Conduct a hypothesis test at the 5% level. NOTE: If you are using a Student's t-distribution for the problem, including for paired data, you may assume that the underlying population is normally distributed. (In general, you must first prove that assumption, though.)
A study is done to determine if students in the California state university system take longer to graduate, on average, than students enrolled in private universities. One hundred students from both the California state university system and private universities are surveyed. Suppose that from years of research, it is known that the population standard deviations are 1.5181 years and 1 year, respectively The following data are collected. The California state university system students took on average 4.5 years with a standard deviation of 0.6. The private university students took on average 4.1 years with a standard deviation of 0.3. Conduct a hypothesis test at the 5% level. NOTE: If you are using a Student's t-distribution for the problem, including for paired data, you may assume that the underlying population is normally distributed. (In general, you must first prove that assumption, though.)

Glencoe Algebra 1, Student Edition, 9780079039897, 0079039898, 2018
18th Edition
ISBN:9780079039897
Author:Carter
Publisher:Carter
Chapter10: Statistics
Section10.4: Distributions Of Data
Problem 19PFA

Related questions
Question
Need help solving on a ti-83 or 84
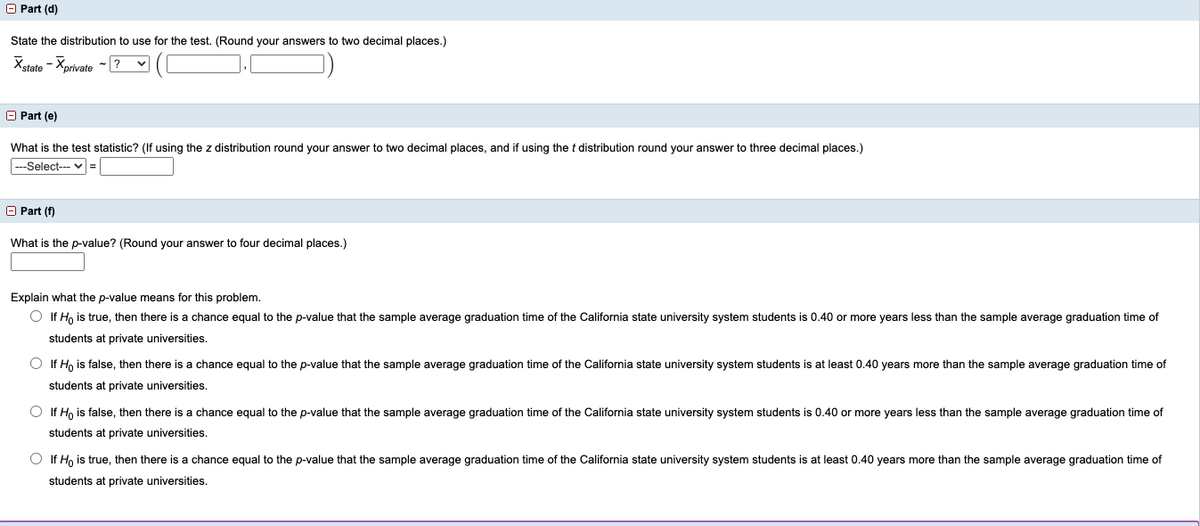
Transcribed Image Text:O Part (d)
State the distribution to use for the test. (Round your answers to two decimal places.)
Xstate - Xprivate - ? v
O Part (e)
What is the test statistic? (If using the z distribution round your answer to two decimal places, and if using the t distribution round your answer to three decimal places.)
|---Select--- v =
O Part (f)
What is the p-value? (Round your answer to four decimal places.)
Explain what the p-value means for this problem.
O If Ho is true, then there is a chance equal to the p-value that the sample average graduation time of the California state university system students is 0.40 or more years less than the sample average graduation time of
students at private universities.
O If H, is false, then there is a chance equal to the p-value that the sample average graduation time of the California state university system students is at least 0.40 years more than the sample average graduation time of
students at private universities.
O If Ho is false, then there is
equal
p-value that
sample average graduation time of the California
university system students i
0.40 or more years
than the sample average graduation time
students at private universities.
O If Ho is true, then there is a chance equal to the p-value that the sample average graduation time of the California state university system students is at least 0.40 years more than the sample average graduation time of
students at private universities.
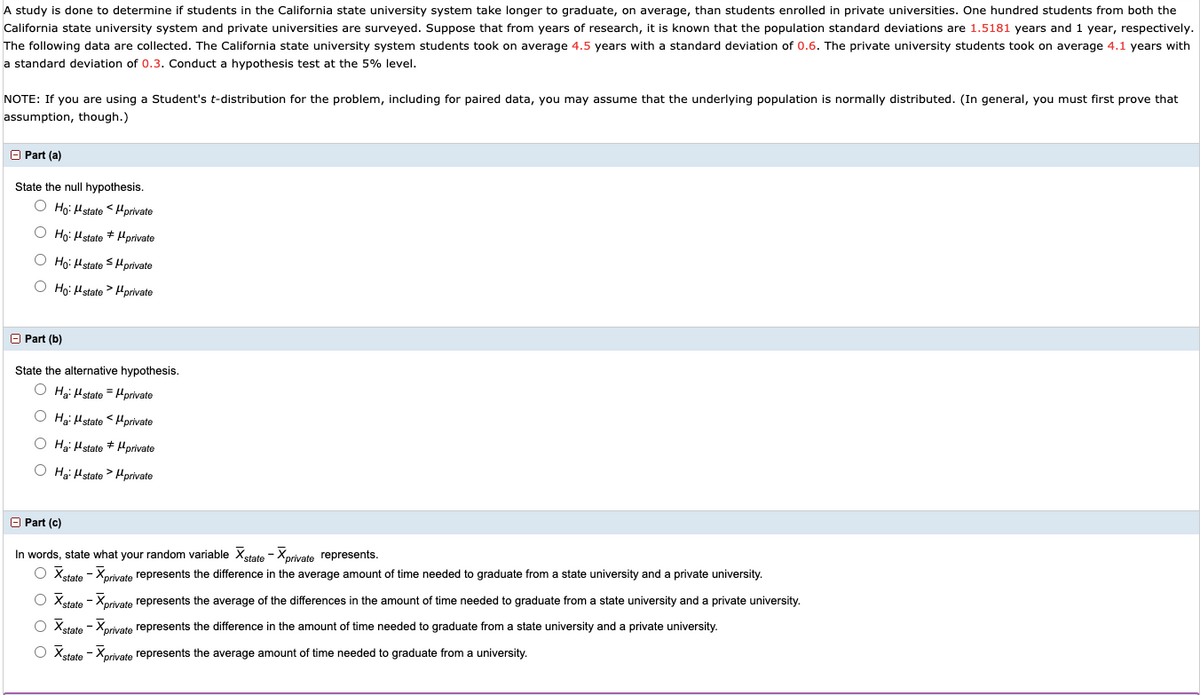
Transcribed Image Text:A study is done to determine if students in the California state university system take longer to graduate, on average, than students enrolled in private universities. One hundred students from both the
California state university system and private universities are surveyed. Suppose that from years of research, it is known that the population standard deviations are 1.5181 years and 1 year, respectively.
The following data are collected. The California state university system students took on average 4.5 years with a standard deviation of 0.6. The private university students took on average 4.1 years with
a standard deviation of 0.3. Conduct a hypothesis test at the 5% level.
NOTE: If you are using a Student's t-distribution for the problem, including for paired data, you may assume that the underlying population is normally distributed. (In general, you must first prove that
assumption, though.)
O Part (a)
State the null hypothesis.
O Họ: Hstate <Hprivate
O Ho: Hstate + Hprivate
O Ho: Hstate S Hprivate
O Họ: Hstate > Hprivate
O Part (b)
State the alternative hypothesis.
O Hai Hstate = Hprivate
O Hgi Hstate < Hprivate
O Hg: Hstate * Hprivate
O Hg: Hstate > Hprivate
O Part (c)
In words, state what your random variable Xstate - Xprivate represents.
O Xetate - Xorivate represents the difference in the average amount of time needed to graduate from a state university and a private university.
O Xstate - Xprivate represents the average of the differences in the amount of time needed to graduate from a state university and a private university.
O Xetate - Xorivate represents the difference in the amount of time needed to graduate from a state university and a private university.
O Xstate - Xorivate represents the average amount of time needed to graduate from a university.
Expert Solution
This question has been solved!
Explore an expertly crafted, step-by-step solution for a thorough understanding of key concepts.

This is a popular solution!

Trending now
This is a popular solution!

Step by step
Solved in 2 steps

Knowledge Booster


Learn more about
Need a deep-dive on the concept behind this application? Look no further. Learn more about this topic, statistics and related others by exploring similar questions and additional content below.Recommended textbooks for you
Glencoe Algebra 1, Student Edition, 9780079039897…
Algebra
ISBN:
9780079039897
Author:
Carter
Publisher:
McGraw Hill
Glencoe Algebra 1, Student Edition, 9780079039897…
Algebra
ISBN:
9780079039897
Author:
Carter
Publisher:
McGraw Hill