
Managerial Economics: Applications, Strategies and Tactics (MindTap Course List)
14th Edition
ISBN:9781305506381
Author:James R. McGuigan, R. Charles Moyer, Frederick H.deB. Harris
Publisher:James R. McGuigan, R. Charles Moyer, Frederick H.deB. Harris
Chapter9: Applications Of Cost Theory
Section: Chapter Questions
Problem 1E

Related questions
Question
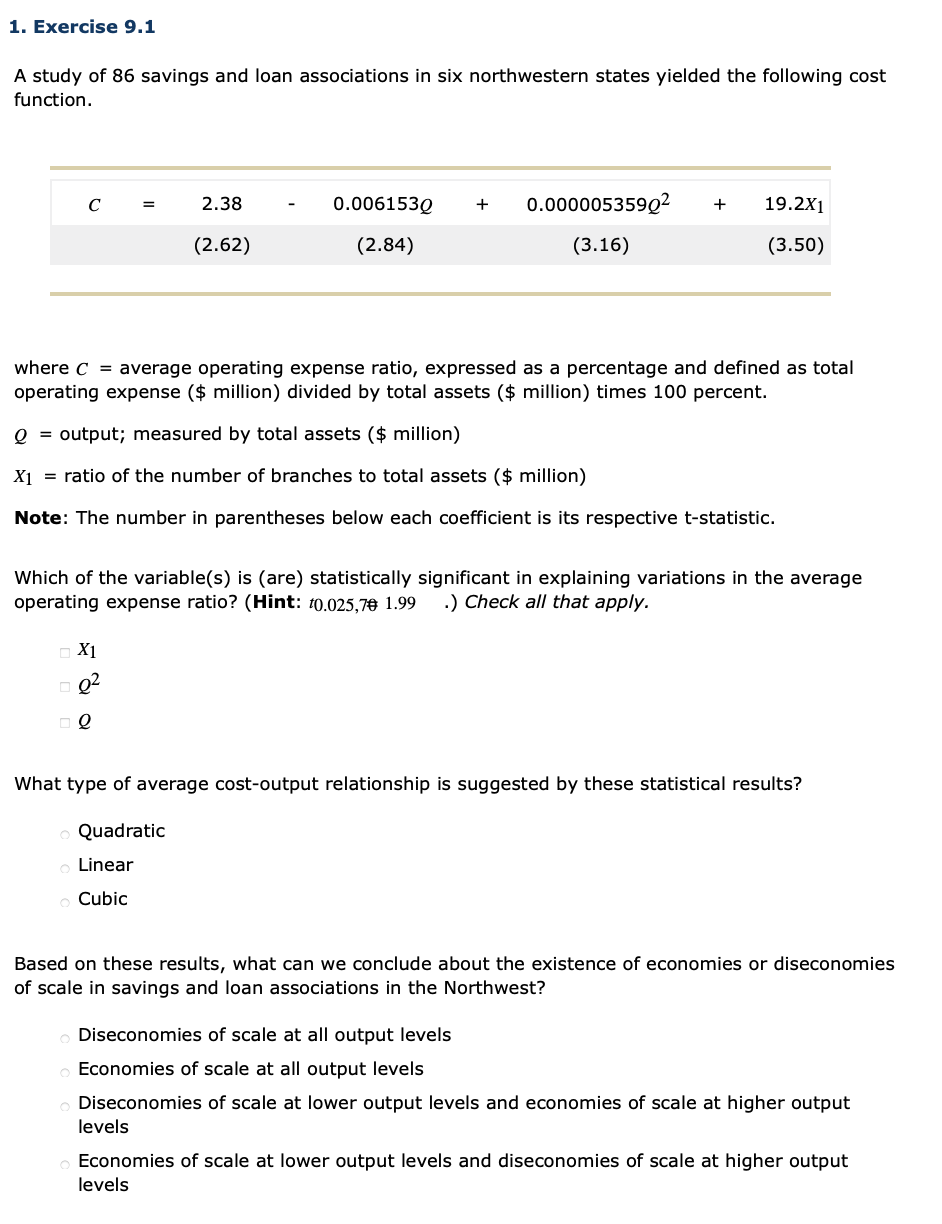
Transcribed Image Text:1. Exercise 9.1
A study of 86 savings and loan associations in six northwestern states yielded the following cost
function.
2.38
0.006153Q
0.000005359Q²
19.2X1
C
+
+
(2.62)
(2.84)
(3.16)
(3.50)
where C = average operating expense ratio, expressed as a percentage and defined as total
operating expense ($ million) divided by total assets ($ million) times 100 percent.
Q = output; measured by total assets ($ million)
X1 = ratio of the number of branches to total assets ($ million)
Note: The number in parentheses below each coefficient is its respective t-statistic.
Which of the variable(s) is (are) statistically significant in explaining variations in the average
operating expense ratio? (Hint: t0.025,7€ 1.99
.) Check all that apply.
X1
Q2
What type of average cost-output relationship is suggested by these statistical results?
Quadratic
Linear
Cubic
Based on these results, what can we conclude about the existence of economies or diseconomies
of scale in savings and loan associations in the Northwest?
Diseconomies of scale at all output levels
Economies of scale at all output levels
Diseconomies of scale at lower output levels and economies of scale at higher output
levels
Economies of scale at lower output levels and diseconomies of scale at higher output
levels
Expert Solution
This question has been solved!
Explore an expertly crafted, step-by-step solution for a thorough understanding of key concepts.

This is a popular solution!

Trending now
This is a popular solution!

Step by step
Solved in 3 steps

Knowledge Booster


Learn more about
Need a deep-dive on the concept behind this application? Look no further. Learn more about this topic, economics and related others by exploring similar questions and additional content below.Recommended textbooks for you
Managerial Economics: Applications, Strategies an…
Economics
ISBN:
9781305506381
Author:
James R. McGuigan, R. Charles Moyer, Frederick H.deB. Harris
Publisher:
Cengage Learning

Managerial Economics: A Problem Solving Approach
Economics
ISBN:
9781337106665
Author:
Luke M. Froeb, Brian T. McCann, Michael R. Ward, Mike Shor
Publisher:
Cengage Learning

Managerial Economics: Applications, Strategies an…
Economics
ISBN:
9781305506381
Author:
James R. McGuigan, R. Charles Moyer, Frederick H.deB. Harris
Publisher:
Cengage Learning
Managerial Economics: A Problem Solving Approach
Economics
ISBN:
9781337106665
Author:
Luke M. Froeb, Brian T. McCann, Michael R. Ward, Mike Shor
Publisher:
Cengage Learning


