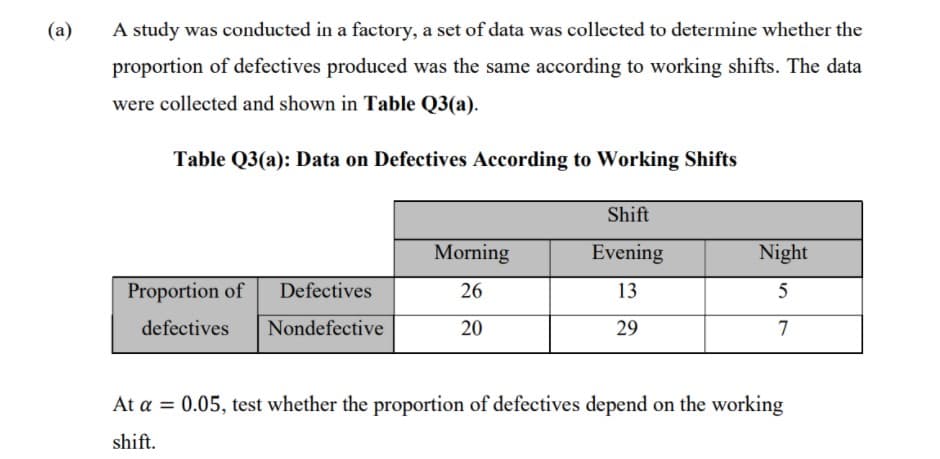
A study was conducted in a factory, a set of data was collected to determine whether the proportion of defectives produced was the same according to working shifts. The data were collected and shown in Table Q3(a). Table Q3(a): Data on Defectives According to Working Shifts Shift Morning Evening Night Proportion of Defectives 26 13 defectives Nondefective 20 29 7 At a = 0.05, test whether the proportion of defectives depend on the working shift.
Q: The Cambridge Study in Delinquent Development was under- taken in north London to investigate the…
A: Solution: 1. Mode: The mode of a dataset is the number which occurs most frequently in the dataset.…
Q: The following table displays data on hypertensive status measured at baseline and incident stroke…
A: Given: Data on hypertensive status measured at baseline and incident stroke over 5 years.…
Q: A researcher is interested in hamster wheel-running activity during the summer versus the winter.…
A: We know, MD-μDsMD~tn-1 Therefore, df=n-1=24
Q: A study of iron deficiency among infants compared blood hemoglobin levels of a random sample of…
A: Given that,mean(x)=13.3standard deviation , s.d1=1.7number(n1)=23mean(y)=12.4standard deviation,…
Q: A researcher is interested in hamster wheel-running activity during the summer versus the winter.…
A: In this case, the researcher is interested to know either the hamsters will run less during the…
Q: Example 13-13. Can vaccination be regarded as a preventive measure for small-pox from the data given…
A:
Q: A sample of 20 students who had recently taken elementary statistics yielded the following…
A: Given Information Total students = 20 Number of students who owned Hewlett Packard calculator = 6…
Q: Previous research has established that nationwide, for older adults, the average score on the Beck…
A: Given: μ=8.13σ=1.56n=200x¯=8.45α=0.01
Q: If you know that in the population adults the average number of hours slept per night is 7 with a…
A:
Q: 5 4月21日周四 28. An environmental group wanted to estimate the proportion of fresh produce sales…
A: We have given the following statement about the proportion.
Q: A researcher is interested in hamster wheel-running activity during the summer versus the winter.…
A:
Q: A researcher is interested in hamster wheel-running activity during the summer versus the winter. He…
A: The average difference score is MD = 3.8, the sum of squares is SS = 522.15 and the sample size is n…
Q: The claim is that the proportion of accidental deaths of the elderly attribute to residential falls…
A: From the provided information: The hypotheses can be constructed as: Null hypothesis: H0: p = 0.15…
Q: 9t 12. Can vaccination be regarded as preventive measure for smallpox, from the data given below?…
A:
Q: A random sample of 42 earthquakes that have occurred between January 2015 and September 2017 was…
A: Explanation: Independent variable: A variable whose deviation doesn't depend on another variable is…
Q: An experiment was conducted to test whether students’ performance (above or below average) is…
A: Ho : students' performance for the selected term in the school is independent of their stressed…
Q: A random sample of n1 = 14 winter days in Denver gave a sample mean pollution index x1 = 43.…
A:
Q: A recent drug survey showed an increase in the use of drugs and alcohol among local high school…
A: Given, n1 = 100, n2 = 100 p1 = 67 and p2 = 61
Q: 3. A psychologist is studying the effects of lack of sleep on the performance of various…
A: According to the given information in this question We need to find p value and conclusion
Q: 3. A psychologist is studying the effects of lack of sleep on the performance of various…
A: The following information has been given: n=36x¯=1.82s=0.22
Q: A researcher believes that tomato variety has an effect on the yield response to side-dressed…
A: A researcher believes that tomato variety has an effect on the yield of response to side-dressed…
Q: A researcher is interested in hamster wheel-running activity during the summer versus the winter.…
A: Given that sample size, n is 25. Sample mean difference, MD = 5.7. Sum of squares, SS = 2851.44.
Q: Blood cocaine concentration (mg/L) was determinedboth for a sample of individuals who had died…
A: a.
Q: We take another look at the confidence in the executive branch of the federal government (CONFED) is…
A: Given information: The two independent variables that are included in executive branch of federal…
Q: A researcher is interested in hamster wheel-running activity during the summer versus the winter.…
A: We have to find standard error.
Q: A researcher wanted to determine if carpeted rooms contain more bacteria than uncarpeted rooms. The…
A: The P-value value is obtained by using EXCEL. The software procedure is given below: Enter the…
Q: Students in QMB 3600-Quantitative Methods in Business course decided to research the relationship…
A: As per the honor code, We’ll answer the first question since the exact one wasn’t specified. Please…
Q: A researcher is interested in hamster wheel-running activity during the summer versus the winter.…
A:
Q: In a study, researchers wanted to measure the effect of alcohol on the hippocampal region, the…
A: It is given that the sample mean is 8.01 and the sample standard deviation is 0.8.The population…
Q: The quality control department of a fabric finishing plant is studying the effects of several…
A: Given :
Q: Researchers measured the distribution of beak sizes in a cohort of medium ground finch hatchlings in…
A: Here you have two tables. Table 1 describes values obtained from calculations, using frequency data…
Q: In an attempt to develop a model of wine quality as judged by wine experts, data on alcohol content…
A:
Q: The owner of Showtime Movie Theaters, Inc., would like to predict weekly gross revenue as a function…
A: Output:
Q: 3. A psychologist is studying the effects of lack of sleep on the performance of various…
A:
Q: A professor believes that the majority of students at the college are in favour of having more…
A: The validity of the claim of the professor, that if the proportion of students in favor of the more…
Q: Pet Owners A study of pet owners showed the following information concerning the ownership of the…
A: Given: Person 1 Person 2 Person 3 Person 4 Dog 5 15 10 25 Cat 10 15 15 15
Q: . The average weight of a Coastal male Grizzly Bear is approximately normal with E(x); =795 pounds…
A: Let X be the random variable from normal distribution with mean E(X) = μ = 795 and standard…
Q: A recent drug survey showed an increase in the use of drugs and alcohol among local high school…
A:
Q: Is sunscreen with an SPF 30 rating more effective at preventing sunburn than sunscreen with an SPF…
A: Denote p15, p30 as the true population proportions of sunburn people who wear SPF 15 and 30…
Q: A researcher used a sample of n = 50 individuals to determine whether there are any preferences…
A: Given : A researcher used a sample of n = 50 individuals to determine whether there are any…
Q: 4. A clinical trial is conducted comparing a new pain reliever for arthritis to a placebo.…
A: Hey there! As per our policy we can answer only 1 ques at a time. Please make a new request for…
Q: Without using software, how would you estimate the number of degrees of freedom for this problem
A: It is given that Sample size for treatment group n1 = 22 Sample size for control group n2 = 24
Q: A researcher is interested in hamster wheel-running activity during the summer versus the winter.…
A:
Q: The results V significantly V so there sufficient evidence to support the claim that most adults…
A: Here you are given that claim Most adults would not erase all of their personal information online…
Q: How do I test the hypothesis that mean daily return on stocks exceeds the mean daily return on…
A: Let μ1 is defined as the population mean daily return on stocks, and μ2 is defined as the population…
Q: 10. If x1, x2 and x3 are three variates measured from their respective means as origin and of equal…
A:
Q: 3. A psychologist is studying the effects of lack of sleep on the performance of various…
A: Followings are the Explanation of the question Use the One sample t test ,because we don't no about…
Q: A random sample of n1 = 11 winter days in Denver gave a sample mean pollution index x1 = 43.…
A: a) The level of significance is 0.01.
Q: We have data from the National Confectioners Association on 6-years worth of candy sales where our…
A: Simple linear regression model: A simple linear regression model is given as y^ = b0 + bx + e…
Q: 1. The relationship between the percentage of African American county residents, perAA, and the…
A: Based on given output, the regression equation is perGore = 26.13 + 0.6054perAA Note : According to…
please give clear answer with proper explanation
Step by step
Solved in 2 steps with 3 images
- Urban Travel Times Population of cities and driving times are related, as shown in the accompanying table, which shows the 1960 population N, in thousands, for several cities, together with the average time T, in minutes, sent by residents driving to work. City Population N Driving time T Los Angeles 6489 16.8 Pittsburgh 1804 12.6 Washington 1808 14.3 Hutchinson 38 6.1 Nashville 347 10.8 Tallahassee 48 7.3 An analysis of these data, along with data from 17 other cities in the United States and Canada, led to a power model of average driving time as a function of population. a Construct a power model of driving time in minutes as a function of population measured in thousands b Is average driving time in Pittsburgh more or less than would be expected from its population? c If you wish to move to a smaller city to reduce your average driving time to work by 25, how much smaller should the city be?Marine biologists have noticed that the color of the outermost growth band on a clam tends to be related to the time of year in which the clam dies. A biologist conducted a small investigation of whether this is true for the species Protothaca staminea. She collected a sample of 55 clam shells in February and 55 clam shells in March. 14 of the shells from February had a dark color on the outermost growth band, whereas 8 of the shells from March had a dark color on the outermost growth band. Carry out a hypothesis test to see if there is a difference in the proportion of shells with a dark outermost growth band between the two months; specifically, if the population proportion in February is higher than March. Let ? = 0.1.Note: Do all calculations as February - MarchA) The point estimate for the true difference in proportion of dark growth bands between February and March is: Note: answer using 4 decimal precisionB) The test statistic, ztest, is: Note: answer using 2 decimal…Marine biologists have noticed that the color of the outermost growth band on a clam tends to be related to the time of year in which the clam dies. A biologist conducted a small investigation of whether this is true for the species Protothaca staminea. She collected a sample of 50 clam shells in February and 27 clam shells in March. 15 of the shells from February had a dark color on the outermost growth band, whereas 8 of the shells from March had a dark color on the outermost growth band. Carry out a hypothesis test to see if there is a difference in the proportion of shells with a dark outermost growth band between the two months. The point estimate for the true difference in proportion of dark growth bands between February and March is:
- Marine biologists have noticed that the color of the outermost growth band on a clam tends to be related to the time of year in which the clam dies. A biologist conducted a small investigation of whether this is true for the species Protothaca staminea. She collected a sample of 50 clam shells in February and 27 clam shells in March. 15 of the shells from February had a dark color on the outermost growth band, whereas 8 of the shells from March had a dark color on the outermost growth band. Carry out a hypothesis test to see if there is a difference in the proportion of shells with a dark outermost growth band between the two months. Let ? = 0.01. A) The point estimate for the true difference in proportion of dark growth bands between February and March is:Marine biologists have noticed that the color of the outermost growth band on a clam tends to be related to the time of year in which the clam dies. A biologist conducted a small investigation of whether this is true for the species Protothaca staminea. She collected a sample of 50 clam shells in February and 27 clam shells in March. 15 of the shells from February had a dark color on the outermost growth band, whereas 8 of the shells from March had a dark color on the outermost growth band. Carry out a hypothesis test to see if there is a difference in the proportion of shells with a dark outermost growth band between the two months. Let ? = 0.01.Note: Do all calculations as February - March A) The point estimate for the true difference in proportion of dark growth bands between February and March is: I need help and webassign rejected the 0.0037 as the answer. I'm so lost. I emailed my professor and he hasn't gotten back to me. Please help. Thank you.An agricultural scientist tests six types of fertilizer, labeled A, B, C, D, E, and F, to determine whether any of them produces an increase in the yield of lima beans over that obtained with the current fertilizer. For fertilizer C, the increase in yield is statistically significant at the 0.05 level. For the other five, the increase is not statistically significant. The scientist concludes that the yield obtained with fertilizer C is greater than that of the current fertilizer. Explain why this conclusion is not justified.
- In a Japanese study, “researchers looked at 35 peoplewith lower back pain who were enrolled in an aquatic exercise program, which included swimming and walk-ing in a pool. Almost all of the patients showed improve-ments after six months, but the researchers found that those who participated at least twice weekly showedmore significant improvement that those who wentonly once per week.”Which of the following statements is true?a) This experiment proves that swimming causes areduction in lower back pain.b) This study is a poorly designed experiment sincethere is no control group and no randomization.c) Conclusions based on this observational study aresuspect since participation in the aquatic programmay be confounded with other lifestyle behaviors thatmay cause the improvement in lower back health.d) Conclusions based on this observational study aresuspect since a sample size of 35 is too small.e) This study is not an observational study since theaquatic program is a treatment.A local group of economists wants to study the effects of the pandemic on the small businesses in their city. A survey was sent out to a random sample of small businesses to anonymously report both their weekly earnings in $1000 for January 2020 (group 1) and January 2021 (group 2). Assume that the weekly earnings are normally distributed. Only 10 businesses provided enough data to compute their average weekly earnings for two months. The groups are dependent. Use α = 0.01 to decide whether there is sufficient evidence that the pandemic reduced the average weekly earnings for small businesses. January 2020 January 2021 58.2 60.5 78.3 62.5 38.2 40.9 32.7 36.2 43.8 36.2 33.7 30.9 50.5 41.4 56.3 38.3 41.1 37.9 26.4 21.7 1. What are the correct hypotheses? H0: H1: 2. Based on the hypotheses, compute the following: Round answers to at least 4 decimal places. The test statistic is = The critical value is =…A local group of economists wants to study the effects of the pandemic on the small businesses in their city. A survey was sent out to a random sample of small businesses to anonymously report both their weekly earnings in $1000 for January 2020 (group 1) and January 2021 (group 2). Assume that the weekly earnings are normally distributed. Only 10 businesses provided enough data to compute their average weekly earnings for two months. The groups are dependent. Use α = 0.01 to decide whether there is sufficient evidence that the pandemic reduced the average weekly earnings for small businesses. January 2020 January 2021 58.5 29.7 37.1 50.8 48.4 36.8 44.8 33.9 72.9 36.5 27.9 45.6 78.5 58.4 53.4 51.2 83.4 47 48.2 33.6 1) What are the correct hypotheses? H0: H1: 2) Based on the hypotheses, compute the following: Round answers to at least 4 decimal places. The test statistic is = The critical value is =…
- A researcher has developed a new drug designed to reduce blood pressure. In an experiment, 22 subjects were assigned randomly to the treatment group and received the new experimental drug. The other 24 subjects were assigned to the control group and received a standard, well-known treatment. After a suitable period, the reduction in blood pressure for each subject was recorded. A summary of these data is: nn x¯x¯ ss Treatment group (new drug) 22 23.48 8.01 Control group (old drug) 24 18.52 7.15 Without using software, how would you estimate the number of degrees of freedom for this problem? Select one: use the larger value, 23, chosen from the two options 21 and 23 use the smaller value, 22, chosen from the two options 22 and 24 use the larger value, 24, chosen from the two options 22 and 24 use the smaller value, 21, chosen from the two options 21 and 23Pet Owners A study of pet owners showed the following information concerning the ownership of the dogs and cats. At =α0.10 , is there a relationship between the number of people in a family and dog or cat ownership? Use the critical value method with tables. 1 person 2 people 3 people 4 or more people Dog 5 15 10 25 Cat 10 15 15 15 1)State the hypotheses and identify the claim. H0: Pet ownership is ▼(DEPENDANT ON or INDEPENDANT OF?) the number of people living in the household. (CLAIM OR NOT CLAIM?) H1 : Pet ownership is (DEPENDANT ON or INDEPENDANT OF?) the number of people living in the household. (CLAIM OR NOT CLAIM?) 2. Find the critical value 3. Compute the test value: X^2= 4. Reject or Do not reject the null hypothesis 5. Summarize: Is there or is there not enough evidence to reject the claim?Is there or is there not enough evidence to support the claim?1) The following data show the results of a study based on the number of hours college students spend playing video games and their GPAs: Number of Hours Playing Video Games(per week)= 42 GPA= 0.2Number of Hours Playing Video Games(per week)= 38 GPA= 0.9Number of Hours Playing Video Games(per week) = 32 GPA= 1.0Number of Hours Playing Video Games(per week) = 26 GPA = 1.1Number of Hours Playing Video Games(per week) = 23 GPA= 1.2Number of Hours Playing Video Games(per week) = 19 GPA= 2.5Number of Hours Playing Video Games(per week) = 15 GPA = 3.0 a) Create a scatter plot and be sure to LABEL BOTH axis and give the chart an overall name. Have the graph display the “r-value” and the correct equation.b) What kind of correlation is this?c) Is this more of a linear or exponential model? Why?d) Predict the standard GPA if a student spends one hour a week playing videogames.