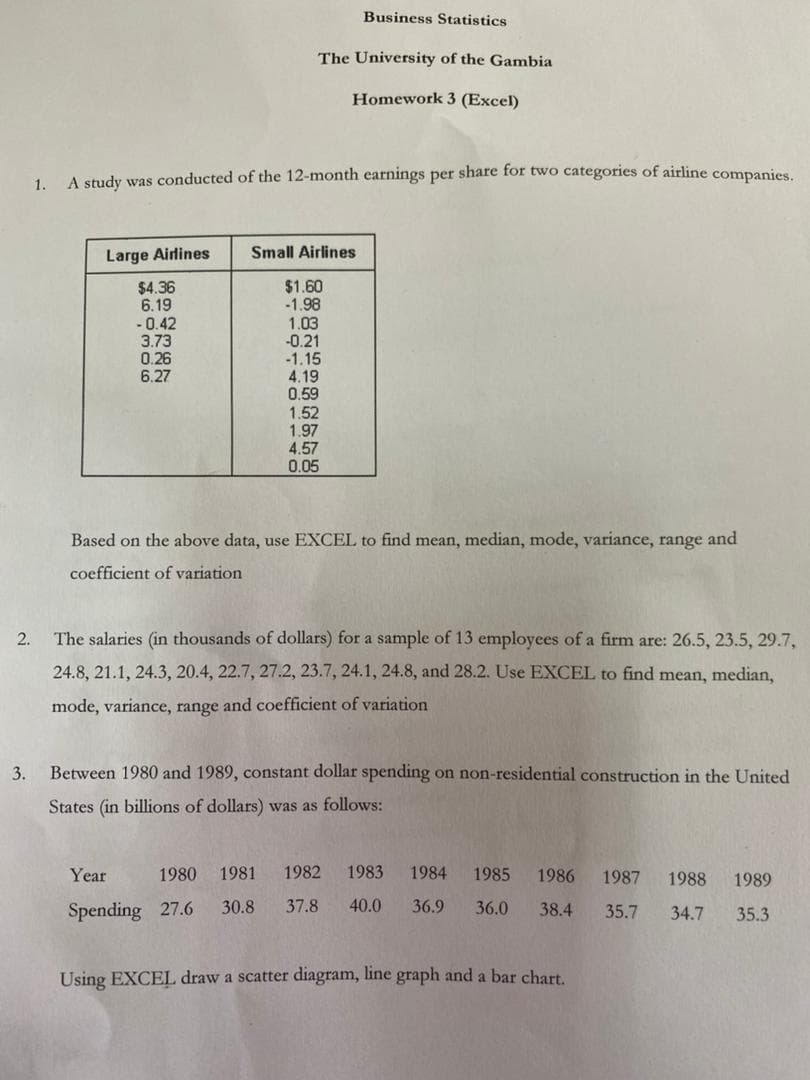
A study was conducted of the 12-month earnings per share for two categories of airline companies. Large Airlines Small Airlines $4.36 6.19 - 0.42 3.73 0.26 6.27 $1.60 -1.98 1.03 -0.21 -1.15 4.19 0.59 1.52 1.97 4.57 0.05 Based on the above data, use EXCEL to find mean, median, mode, variance, range and coefficient of variation

Glencoe Algebra 1, Student Edition, 9780079039897, 0079039898, 2018
18th Edition
ISBN:9780079039897
Author:Carter
Publisher:Carter
Chapter10: Statistics
Section10.6: Summarizing Categorical Data
Problem 10CYU
icon
Related questions
icon
Concept explainers
Topic Video
Question
Business Statistics
The University of the Gambia
Homework 3 (Excel)
A study was conducted of the 12-month earnings per share for two categories of airline companies.
1.
Large Airlines
Small Airlines
$4.36
6.19
- 0.42
3.73
0.26
6.27
$1.60
-1.98
1.03
-0.21
-1.15
4.19
0.59
1.52
1.97
4.57
0.05
Based on the above data, use EXCEL to find mean, median, mode, variance, range and
coefficient of variation
2.
The salaries (in thousands of dollars) for a sample of 13 employees of a firm are: 26.5, 23.5, 29.7,
24.8, 21.1, 24.3, 20.4, 22.7, 27.2, 23.7, 24.1, 24.8, and 28.2. Use EXCEL to find mean, median,
mode, variance, range and coefficient of variation
3.
Between 1980 and 1989, constant dollar spending on non-residential construction in the United
States (in billions of dollars) was as follows:
Year
1981
1982
1983
1984
1985
1986
1987
1988
1989
Spending 27.6
30.8
37.8
40.0
36.9
36.0
38.4
35.7
34.7
35.3
Using EXCEL draw a scatter diagram, line graph and a bar chart.
Transcribed Image Text:Business Statistics The University of the Gambia Homework 3 (Excel) A study was conducted of the 12-month earnings per share for two categories of airline companies. 1. Large Airlines Small Airlines $4.36 6.19 - 0.42 3.73 0.26 6.27 $1.60 -1.98 1.03 -0.21 -1.15 4.19 0.59 1.52 1.97 4.57 0.05 Based on the above data, use EXCEL to find mean, median, mode, variance, range and coefficient of variation 2. The salaries (in thousands of dollars) for a sample of 13 employees of a firm are: 26.5, 23.5, 29.7, 24.8, 21.1, 24.3, 20.4, 22.7, 27.2, 23.7, 24.1, 24.8, and 28.2. Use EXCEL to find mean, median, mode, variance, range and coefficient of variation 3. Between 1980 and 1989, constant dollar spending on non-residential construction in the United States (in billions of dollars) was as follows: Year 1981 1982 1983 1984 1985 1986 1987 1988 1989 Spending 27.6 30.8 37.8 40.0 36.9 36.0 38.4 35.7 34.7 35.3 Using EXCEL draw a scatter diagram, line graph and a bar chart.
Expert Solution
trending now

Trending now

This is a popular solution!

steps

Step by step

Solved in 2 steps with 2 images

Blurred answer
Knowledge Booster
Centre, Spread, and Shape of a Distribution
Learn more about
Need a deep-dive on the concept behind this application? Look no further. Learn more about this topic, statistics and related others by exploring similar questions and additional content below.
Recommended textbooks for you
Glencoe Algebra 1, Student Edition, 9780079039897…
Algebra
ISBN:
9780079039897
Author:
Carter
Publisher:
McGraw Hill
Linear Algebra: A Modern Introduction
Algebra
ISBN:
9781285463247
Author:
David Poole
Publisher:
Cengage Learning
Big Ideas Math A Bridge To Success Algebra 1: Stu…
Algebra
ISBN:
9781680331141
Author:
HOUGHTON MIFFLIN HARCOURT
Publisher:
Houghton Mifflin Harcourt