An environmentalist wanted to determine if the mean acidity of rain differed among Alaska, Florida, and Texas. He randomly selected six rain dates at each of the three locations and obtained the following data given. a)What is the response variable b)What is the factor variable? c)What are the levels of the factor (treatments)?


Q: 3. (Refer to Krejcie and Morgan Table) Considering the 1, 200 students in the School of Teacher…
A: Given information: Method to be used: Krejcie & Morgan sample size determination method…
Q: 1) Using EXCEL and the Cell Phone Survey data answer the following questions by using COUNTIF and…
A: Hi! Thank you for the question, as per the honor code, we are allowed to answer three sub-parts at a…
Q: Give a sample of a research proposal?
A: Developing a research proposal involves the following preliminary steps: identifying potential…
Q: The symbol u, represents the mean of a sample of size n. True False
A:
Q: a. What experimental design is most appropriate to use in the given problem? b. How many levels are…
A: Given Data :
Q: An insurance company selected samples of clients under 18 years of age and over 18 and recorded the…
A: Two sample proportion test: Two sample proportion test is used to test the significance difference…
Q: The New Vision, Uganda’s leading newspaper on August 26, 2020, reported the following coronavirus…
A: Note: Hi there! Thank you for posting the question. As there are multiple sub parts, according to…
Q: The symbol represents the mean of the sample. OTrue OFalse
A: Statement is :The symbol x¯ represents the mean of the sample.
Q: A survey was taken on course selection and gender. The results are represented in the table below…
A: Given data, P(Team sports)=?
Q: Is the transportation mode used to ship goods independent of type of industry? Suppose the following…
A: The null and alternative hypotheses for the test are: H0: Transportation mode used to ship goods…
Q: What proportion of the total number of ratings rec Customer Satisfaction Survey Monthly Regional…
A: Solution: The given table of data is
Q: Consider the following: at Bernhardt College, 200 (of the 3,000) students were polled and asked how…
A: From the given information, At Bernhardt College, 200 (of the 3,000) students were polled and asked…
Q: In order to study whether average salary of UW graduates is related to their race, data was…
A:
Q: Find out by interpolation from the following data the number of workers earning $24 or more but less…
A:
Q: The city council of Pine Bluffs is considering increasing the number of police in an effort to…
A: (a) Response variable or dependent variable: A variable that is changed due to the impact of the…
Q: 2. Use the data from the Venn diagram below to answer these questions. (a) How many non-adult dogs…
A:
Q: d) If your random sample actually produced a mean of 723,500 php, would you consider this as…
A: Here use rule for finding unusual range That is values those are above 2 standard deviation from…
Q: For the following studies, describe the population, sample, population parameter, and sample…
A: Part a: For the defined problem, we have, Population: Entire population of the whole Philippines…
Q: Listed below are the weights in pounds of 11 players randomly selected from the roster of a…
A: The weights of 11 players from the roster of a championship sports team are randomly selected and…
Q: In mileage consumption testing, automobiles were road-tested for both Metropolitan and Fre-…
A: metropolitan freeway 16 19 17 20 19 18 14 18 18 19 15 17 16 17 16 18 18 19
Q: Answer the following using the Boxplot attached. 1a) Which region (North or South) has the town…
A: The box plot is used to depict the distribution of dataset. For vertical box plots, the lower end is…
Q: . Given below are data used to evaluate relationship between three morphological variables of…
A: Simple linear regression: A simple linear regression model is given as y^ = b0 + bx + e where y^ is…
Q: Determine the regression equation. (Negative amounts should be indicated by a minus sign. Round your…
A: Given that X Y X \cdot YX⋅Y X^2X2 Y^2Y2 19 19 361 361 361 21 15 315 441 225 26 9…
Q: Complete the following sentence: When comparing a ____________variable with ___________ categories…
A:
Q: d. Draw the dot plot for the sample means obtained in part (b) and makes comment.
A:
Q: What significance test can be used to assess whether there is a relationship between receiving an…
A: Chi-square test is used to test relationship between two categorical variables. Receiving an…
Q: For a sample of size 25, degrees of freedom is equal to _____.
A: From the given information, Sample size = 25 The objective is to find the degrees of freedom.
Q: The arm span and foot length were measured (in centimeters) for each of the 19 students in a…
A: From the graph, the straight line in the graph is the regression equation
Q: In a study of all 2965 professors at a college, it is found that 45% own a computer. Determine…
A: It is given that 45% of professors have own computers out of 2,965 professors.
Q: Consider the numbers 2 3 4 5 5 Compute the mode,median and mean
A: Given data : 2,3,4,5,5 Mean, x =Sum of all the numbersTotal no. of numbers Median, M = The middle…
Q: A study was made in T.I.P. Quezon City which will determine the relationship between the sales and…
A: Given: Sales Costs 368 1.7 340 1.5 665 2.8 954 5 331 1.3 556 2.2 376 1.3…
Q: Samples of emissions from three suppliers are classified for conformance to air-quality…
A: To find: How many emissions are examined in this study.
Q: How many respondents should be chosen from Luzon? How many respondents should be chosen from…
A: Here given,. Suppose you need to take a sample of respondents who own a Laundry Business from Luzon,…
Q: The city council of Pine Bluffs is considering increasing the number of police in an effort to…
A: Given: City Police Number of Crimes City Police Number of Crimes Oxford 15 17 Holgate 17 7…
Q: Consider the corresponding contingency table in a sample of patients from a hospital. There is the…
A: Percentage is a number expressed as a fraction of 100. The symbol % is used to denote percentage.…
Q: If 40% of all the students are taking four classes, and 60% of all the students are taking three…
A:
Q: During the first 13weeks of the television season, the Saturday evening 8:00 p.m. to 9:00 p.m.…
A: To test whether the collected sample comes from the specific population or not, the chi-square…
Q: Given the data set belo mean, median, mode, ram variance, and sample sta
A: The given data is 1 0 0 0 0 0 0 0 0 0 0 0 0 0 0 0 1 0 0 0 0 0 1 0 0 1 0 0 1 0 0 0 0 2 0 0 0…
Q: A state employee wishes to see if there is a signifificant difference in the number of employees at…
A:
Q: The table below shows the lists of weights (in pounds) of paper discarded by a sample of.…
A: It is given that the list of weights of paper along with the sizes of the households.
Q: Given below are data used to evaluate relationship between three morphological variables of…
A: Simple linear regression: A simple linear regression model is given as y^ = b0 + bx + e where y^ is…
Q: Find the nearest neighbor statistic for the following pattern assuming a study area of 40 km2. 3.5…
A:
Q: Which statistic (mean, median, or mode) is most appropriate in each of the following situations?
A: Given data Which statistic (mean , median , mode ) is most appropriate in each of the…
Q: A J.D. Power and Associates vehicle quality survey asked new owners a variety of rating of the…
A: Given : Quality rating \ \Education Some HS HS Grad some college College Grad Total Average 30…
Q: mean, the median, and the mode of the following salaries of employees of the Moe D. Lawn Landscaping…
A: Given : The given frequency distribution table is X Frequency 24000 4 29000 3 30000 2…
Q: Compute the crude and standardized death rates in two cities from the following data and find out…
A: * SOLUTION :- Given data,
Q: The city council of Pine Bluffs is considering increasing the number of police in an effort to…
A: From the provided information, City Police Number of crimes Oxford 15 19…
Q: Is there a difference in the means of the three groups? If so, which groups show significant…
A: t-test is used to compare the means of two groups, so then ANOVA is some sort extension that allows…
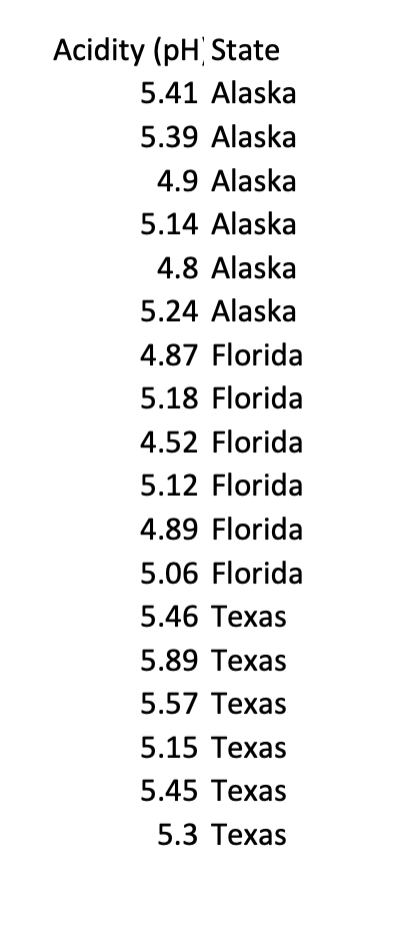
An environmentalist wanted to determine if the mean acidity of rain differed among Alaska, Florida, and Texas. He randomly selected six rain dates at each of the three locations and obtained the following data given.
a)What is the response variable
b)What is the factor variable?
c)What are the levels of the factor (treatments)?


Trending now
This is a popular solution!

Step by step
Solved in 2 steps

- What does the y -intercept on the graph of a logistic equation correspond to for a population modeled by that equation?Is carbon dating? Why does it work? Give an example in which carbon dating would be useful.Urban Travel Times Population of cities and driving times are related, as shown in the accompanying table, which shows the 1960 population N, in thousands, for several cities, together with the average time T, in minutes, sent by residents driving to work. City Population N Driving time T Los Angeles 6489 16.8 Pittsburgh 1804 12.6 Washington 1808 14.3 Hutchinson 38 6.1 Nashville 347 10.8 Tallahassee 48 7.3 An analysis of these data, along with data from 17 other cities in the United States and Canada, led to a power model of average driving time as a function of population. a Construct a power model of driving time in minutes as a function of population measured in thousands b Is average driving time in Pittsburgh more or less than would be expected from its population? c If you wish to move to a smaller city to reduce your average driving time to work by 25, how much smaller should the city be?
- Murder was committed in an air-conditioned laboratory. Dr. Quincy, the medical examiner, was summoned to the scene of the crime. One of the first things he did was to take the temperature of the corpse. At 9:23 PM, he recorded the temperature to be 20.1oC and at 9:53 Pm to be 18.7oC. He further observed that the thermostat of the air-conditioning unit was set at 16oC. After gathering all pertinent data and analyzing them for sometime, he submitted a preliminary report stating that the victim was murdered between 7 PM and 8 PM. Was Dr. Quincy's report correct? At what approximate time did the victim die? Assume that the normal body temperature of a human being, alive and well, is 37oC.1.Carbon dioxide is known to have a critical effect on microbiological growth. Small amounts of CO2 stimulate growth of some organisms, whereas high concentrations inhibit the growth of most. The latter effect is used commercially when perishable food products are stored. A study is conducted to investigate the effect of CO2 on the growth rate of pseudomonas fragi, a food-spoiling organism. Carbon dioxide is administered at five predetermined different atmospheric pressures. The response measured was the percentage change in cell mass after 1-hour growing time. Ten cultures were used at each atmospheric pressure level, resulting in the following data: 0.0 .083 .29 .50 .86 62.6 50.9 45.5 29.5 24.9 59.6 44.3 41.1 22.8 17.2 64.5 47.5 29.8 19.2 7.8 59.3 49.5 38.3 20.6 10.5 58.6 48.5 40.2 29.2 17.8 64.6 50.4 38.5 24.1 22.1 50.9 35.2 30.2 22.6 22.6 56.2 49.9 27.0 32.7 16.8 52.3…Turbid water is muddy or cloudy water. Sunlight is necessary for most life forms; thus turbid water is considered a threat to wetland ecosystems. Passive filtration systems are commonly used to reduce turbidity in wetlands. Suspended solids are measured in mg/l. Is there a relation between input and output turbidity for a passive filtration system and, if so, is it statistically significant? At a wetlands environment in Illinois, the inlet and outlet turbidity of a passive filtration system have been measured. A random sample of measurements are shown below. (Reference: EPA Wetland Case Studies.) Reading 1 2 3 4 5 6 7 8 9 10 11 12 Inlet (mg/l) 62.1 13.8 63.5 30.6 91.1 11.5 67.2 75.6 79.3 29.5 72.9 21.3 Outlet (mg/l) 11.3 2.7 7.5 12.3 12.9 3.8 13.3 13.2 15.1 6.0 7.0 4.7 Use a 1% level of significance to test the claim that there is a monotone relationship (either way) between the ranks of the inlet readings and outlet readings. (a) Rank-order the inlet readings using 1 as…
- Turbid water is muddy or cloudy water. Sunlight is necessary for most life forms; thus turbid water is considered a threat to wetland ecosystems. Passive filtration systems are commonly used to reduce turbidity in wetlands. Suspended solids are measured in mg/l. Is there a relation between input and output turbidity for a passive filtration system and, if so, is it statistically significant? At a wetlands environment in Illinois, the inlet and outlet turbidity of a passive filtration system have been measured. A random sample of measurements are shown below. (Reference: EPA Wetland Case Studies.) Reading 1 2 3 4 5 6 7 8 9 10 11 12 Inlet (mg/l) 59.1 25.7 70.5 71.0 37.6 43.5 13.1 24.2 16.7 49.1 67.6 31.7 Outlet (mg/l) 18.2 14.3 15.3 17.5 13.1 8.0 4.1 4.4 4.3 5.8 16.3 7.1 Use a 1% level of significance to test the claim that there is a monotone relationship (either way) between the ranks of the inlet readings and outlet readings. (a) Rank-order the inlet readings using 1 as…Turbid water is muddy or cloudy water. Sunlight is necessary for most life forms; thus turbid water is considered a threat to wetland ecosystems. Passive filtration systems are commonly used to reduce turbidity in wetlands. Suspended solids are measured in mg/l. Is there a relation between input and output turbidity for a passive filtration system and, if so, is it statistically significant? At a wetlands environment in Illinois, the inlet and outlet turbidity of a passive filtration system have been measured. A random sample of measurements are shown below. (Reference: EPA Wetland Case Studies.) Use a 1% level of significance to test the claim that there is a monotone relationship (either way) between the ranks of the inlet readings and outlet readings. (a) Rank-order the inlet readings using 1 as the largest data value. Also rank-order the outlet readings using 1 as the largest data value. Then construct a table of ranks to be used for a Spearman rank correlation test. (c) Compute…Carbon foot print: Carbon dioxide CO2 is produced by burning fossil fuels such as oil and natural gas, and has been connected to global warming. The following table presents the average amounts (in metric tons) of CO2 emissions for certain years per person in the United States and per person in the rest of the world. Year Non-U.S. U.S. 1993 3.3 19.7 1994 3.3 19.8 1995 3.3 19.5 1996 3.4 19.7 1997 3.4 20.0 1999 3.2 19.6 2000 3.3 20.0 2001 3.3 19.6 2004 3.7 19.6 Compute the least-squares regression line for predicting U.S. emissions from non-U.S. emissions. Round the slope and y-intercept to at least four decimal places.
- The media often seizes on yearly changes in crime or other statistics. A large jump in thenumber of murders from one year to the next, or a large. Decline in the support for a particularpolitical party may become the subject of many news reports and analysis. These statistics maybe expected to show some shift from year to year, just because there is variation in anyphenomenon. This question addresses this issue by looking at changes in the annual number ofsuicides in the province of India.‘Suicides in India declined by more than 13% from 1993 to 1994,” was the headline in theIndia Times in early 1995. The article went on to interview several noted experts on suicidewho gave possible reasons for the large decline. As a student who has just completed asimulation & Modeling course, you came across the article and decide to check out the data.By consulting Table given below of India Health, Vital Statistics, Annual Report, for variousyears, you find the figures for 1990-2001. The data…Inorganic phosphorous is a naturally occurring element in all plants and animals, with concentrations increasing progressively up the food chain (fruit < vegetables < cereals < nuts < corpse). Geochemical surveys take soil samples to determine phosphorous content (in ppm, parts per million). A high phosphorous content may or may not indicate an ancient burial site, food storage site, or even a garbage dump. Independent random samples from two regions gave the following phosphorous measurements (in ppm). Assume the distribution of phosphorous is mound-shaped and symmetric for these two regions. Region 1: x1;n1=15 857 1,551 1,230 875 1,080 2,330 1,850 1,860 2,340 1,080 910 1,130 1,450 1,260 1,010 region 11: x2;n2-14 538 812 790 1,230 1,770 960 1,650 860 890 640 1,180 1,160 1,050 1,020 (a)Use a calculator with mean and standard deviation keys to verify that x1, s1, x2, and s2. (Round your answers to four decimal places.) x1= ppm s1= ppm x2= ppm s2= ppm…Inorganic phosphorous is a naturally occurring element in all plants and animals, with concentrations increasing progressively up the food chain (fruit < vegetables < cereals < nuts < corpse). Geochemical surveys take soil samples to determine phosphorous content (in ppm, parts per million). A high phosphorous content may or may not indicate an ancient burial site, food storage site, or even a garbage dump. Independent random samples from two regions gave the following phosphorous measurements (in ppm). Assume the distribution of phosphorous is mound-shaped and symmetric for these two regions. REGION I:X1;N1=15 857 1,551 1,230 875 1,080 2,330 1,850 1,860 2,340 1,080 910 1,130 1,450 1,260 1,010 REGION II:X2;N2=14 538 812 790 1,230 1,770 960 1,650 860 890 640 1,180 1,160 1,050 1,020 (a) Use a calculator with mean and standard deviation keys to verify that x1, s1, x2, and s2. (Round your answers to four decimal places.) x1= ppm s1= ppm x2= ppm s2= ppm…


