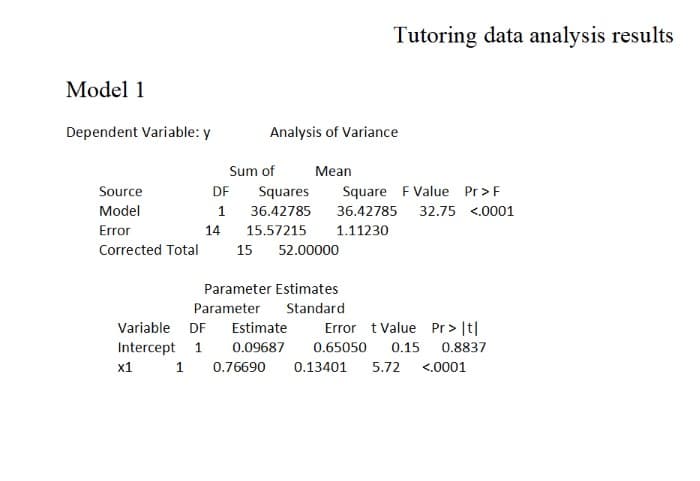
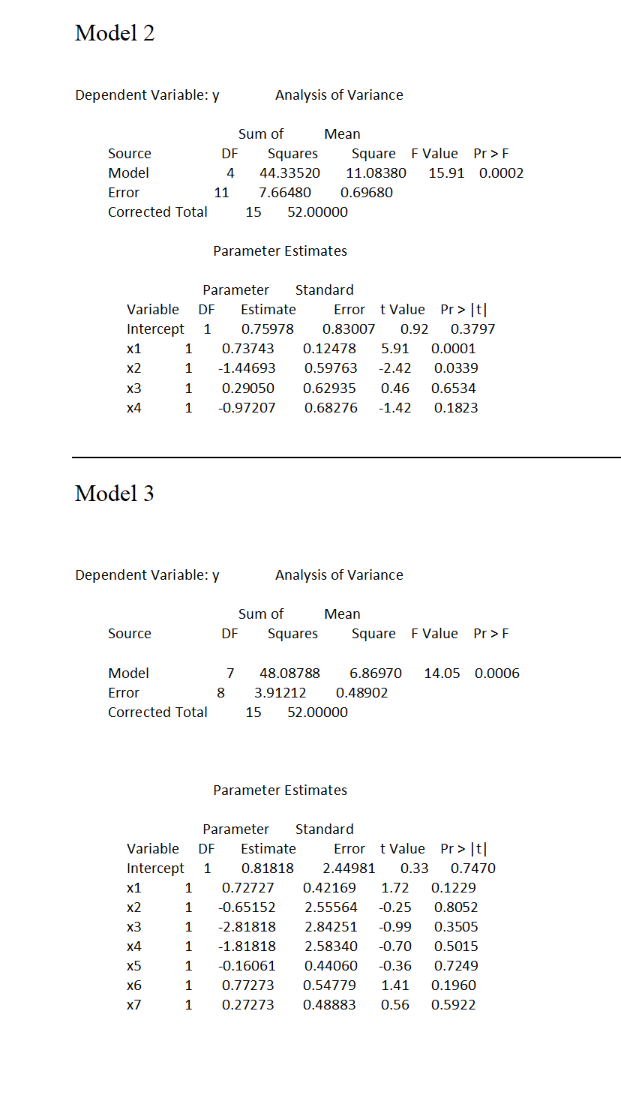
A study was conducted to examine four methods for tutoring in mathematics. Four students were randomly assigned to each method, and a pretest score (x1) was obtained before tutoring began. The response of interest is a posttest score (y), and dummy variables x2, x3, and x4, were created for methods 1, 2, and 3, respectively. Variables x5, x6, and x7, are crossproduct variables for methods 1, 2, and 3, respectively, multiplied by x1. The results from fitting three regression models to these data are attached to the end of the exam. Since the posttest score is harder than the pretest, it is not unusual for x1 values to be higher than y values. a) Assuming that the parallelism assumption is valid, test for equality of the adjusted group means, using alpha = .05. Write the null and alternative hypotheses, calculate an F statistic value, compare it to a tabled value and state your conclusion from the hypothesis test. b) Use the fact that the sample mean of x1 is 4.44, and the printout from the model assuming parallelism but unequal intercepts, to estimate adjusted means for each of the four groups. c) The three models for the thread data are labeled on the printout as Models 1, 2, and 3. Usually our comparisons have been between Models 1 and 2, and between Models 2 and 3. What set of parameters are being tested if we compare Model 1 to Model 3? Why is this test not usually performed, even though it is also testing for differences between groups?


2) A study was conducted to examine four methods for tutoring in mathematics. Four students
were randomly assigned to each method, and a pretest score (x1) was obtained before tutoring
began. The response of interest is a posttest score (y), and dummy variables x2, x3, and x4, were
created for methods 1, 2, and 3, respectively. Variables x5, x6, and x7, are crossproduct
variables for methods 1, 2, and 3, respectively, multiplied by x1. The results from fitting three
regression models to these data are attached to the end of the exam. Since the posttest score is
harder than the pretest, it is not unusual for x1 values to be higher than y values.
a) Assuming that the parallelism assumption is valid, test for equality of the adjusted
group means, using alpha = .05. Write the null and alternative hypotheses, calculate an F statistic
value, compare it to a tabled value and state your conclusion from the hypothesis test.
b) Use the fact that the sample
assuming parallelism but unequal intercepts, to estimate adjusted means for each of the four
groups.
c) The three models for the thread data are labeled on the printout as Models 1, 2, and
3. Usually our comparisons have been between Models 1 and 2, and between Models 2 and 3.
What set of parameters are being tested if we compare Model 1 to Model 3? Why is this test not
usually performed, even though it is also testing for differences between groups?


Trending now
This is a popular solution!

Step by step
Solved in 5 steps with 42 images


