A study was conducted to see whether heart rate (y) on swimmers linearly related to their age (x1) and swimming time for 2000 meters (x2). A random sample of ten swimmers was selected and the result is shown in the following Microsoft Excel output. (a) Interpret the value of R2 from the output. (b) Conduct a hypothesis test to test whether the linear regression model is fit or not using a = 0.05. (c) Calculate the 95% confidence interval for the coefficient value for age
Q: Based on the data shown below, calculate the correlation coefficient (rounded to three decimal…
A: here we have to find out the correlation coefficient of the given data x y 1 7.9 2 8.2 3…
Q: Weight on XOM | Weight on PFE 0.1 0.9 0.2 0.8 0.3 0.7 0.4 0.6 0.5 0.5 0.6 0.4 0.7 0.3 0.8 0.2 0.9…
A: Given data of portfolio as shown below
Q: Lifetimes of AAA batteries are approximately normally distributed. A manufacturer wants to estimate…
A: Given: Sample size n=25 Sample mean = 9.9 hour Sample standard deviations s=1.9 To find 99%…
Q: In an apartment complex the probability a tenant has a dog is 40% and the probability a tenant has a…
A: Answer :- Given P(D) = 0.40, P(C) = 0.37 and P(C∩D) = 0.15 Here P(D) = Probability…
Q: Researchers determined that 60 Kleenex tissues is the average number of tissues used during a cold.…
A: Solution: Given information: n= 100 Sample size x=52 Sample mean s= 22 Sample standard deviation μ=…
Q: Two samples are taken with the following sample means, sizes, and standard deviations ¯x1 = 22 ; x¯2…
A: There are two independent samples which follows normal distribution. We have to construct 99%…
Q: QUESTION 20 Which is true of the standard error of the mean? O It is the amount of error when…
A: We have to Find which statement is true about Standard error : As we know that formula for standard…
Q: 99.5% confidence interval, for μ1−μ2 given the following information. n1=25, ¯x1=2.4 s1=0.79 n2=45,…
A: given data n1=25n2=45x1¯ = 2.4x2¯ = 2.9s1=0.79s2=0.33confidence interval = 0.995α = 1-0.995=0.005
Q: You are conducting a test of homogeneity for the claim that two different populations have the same…
A:
Q: You wish to test the following claim (HaHa) at a significance level of α=0.001α=0.001.…
A: Given Information: The objective is to test the claim (Ha) at a significance level of α=0.001…
Q: Variable descriptions Gender = 0 (male), 1 (female) Major = student's major Age = age of student in…
A:
Q: The manufacturer of a fertilizer guarantees that, with the aid of the fertilizer, 65% of planted…
A: Given that
Q: You are conducting a test of homogeneity for the claim that two different populations have the same…
A:
Q: You are conducting a test of homogeneity for the claim that two different populations have the same…
A: The following data has been provided: Observed Frequencies: Category Population#1 Population#2…
Q: Refer to the table below, the average number of chocolate chips per cookie in two competing…
A: The distributions of chocolate chips, that is obtained for the Brands A and B at the sample level…
Q: Class: Frequency: Calculate the median of the following frequency distribution: 40-50 16 20-30 6…
A:
Q: The average effect size in social psychology is around d = 0.21. Conventionally, a sample over 30…
A: The provided information is as follows: d=0.21n1=30n2=30 Consider the significance level α=0.05.
Q: The smallest numeric value in a data set subtracted from the largest is the: a. variance. O b.…
A: We have to find the term which is the difference between the largest value and the smallest value.
Q: A randomsample of 62 observations with a mean of 117 anda population variance of 98,determine the…
A: From the provided information, Sample size (n) = 62 Population variance (σ2) = 98 Sample mean (x̄) =…
Q: You are conducting a test of independence for the claim that there is an association between the row…
A: Given that Observed Frequency table X Y Z A 31 4 28 B 20 62 25
Q: Find the interval containing the middle-most 94% of sample means:
A: Given: Mean, μ=210standard deviation, σ=20Sample size, n=32
Q: Which of the following is not a definition of probabilistic independence? Select one: O a.…
A:
Q: Many college graduates who are employed full-time have longer than 40-hour work weeks. Suppose that…
A: Sample size is the number of observation involved in the sample. Sample is the subset of population…
Q: QUESTION 45 "A researcher would like to evaluate the potential effect of a pain-relief patch…
A: Given sample mean for difference x̄d=-5.1, n=8, ss=68.7
Q: 5) Two samples are taken with the following sample means, sizes, and standard deviations ¯x1 = 20…
A: Solution: Given information: n1=61n2=50x1=20x2= 29s1=2s2=5
Q: Suppose Z follows the standard normal distribution. Calculate the following probabilities using the…
A: Here we have to find the following probabilities a) P(Z ≤ -0.60) b) P(Z > 1.41) c) P(-1.07 <…
Q: Chauncey Billups, a current shooting guard for the Los Angeles Clippers, has a career free-throw…
A: Given that n = 6 , p = 89.4% = 0.894 , q = 1 - p = 1 - 0.894 = 0.106 p = Probability of free…
Q: Jack's term mark is 72. The term mark counts for 80% of the final mark. What mark must Jack get on…
A:
Q: A distribution of values is normal with a mean of 210 and a standard deviation of 20. From this…
A: A distribution of valus is normal with μ=210σ=20n=32here we have to find the interval containing the…
Q: The object of a general chemistry experiment is to determine the amount (in millilitres [mL]) of…
A: The sampled volume of NaOH (in mL) required to attain the specified pH level is given as: 82.20,…
Q: ou wish to test the following claim (HaHa) at a significance level of α=0.005α=0.005.…
A: Given that n1=544p1=0.441n2=328p2=0.345α=0.005
Q: What are their accuracies and precisions? Why don't my SigFigs match?
A: We have three dispensers each having a volume of 296 ml. The Actual volume is 296 ml.
Q: You run a regression analysis on a bivariate set of data (n = 80). With a = 78.4 and y = 56.8, you…
A:
Q: me probability of an integrated circuit passing a quality test is 0.86. In a batch of 10 integrated…
A: If an experiment has only two outcomes, then Bernoulli distribution is used. If that same experiment…
Q: Random samples of size 81 are taken from a process (an infinite populati 200 and 18, respectively.…
A: A sample size is 81; n=81 Mean and standard deviation of sample taken from infinite population is…
Q: If X₁, X₂...., Xbe independent and identically distributed sample taken from N(µ, 1), our estimate…
A: Given: X1,X2.......Xn~Nμ,1 T=∑i=1nXi
Q: (a) Construct a graphical display that represents the association between gender and job experience…
A: In the given scenario, a contingency table was given that contains the categories of job experience…
Q: Suppose the newspaper states that the probability of rain today is 40%. What is the complement of…
A: given data probability of rain today = 40% in symbol : p(rain today) = 0.40
Q: 15) fill in the blank. What is the p-value? What can you conclude about the quality of the…
A: Introduction: It is required to identify the p-value, and conclude about the equality of the…
Q: Suppose you just bought one share of stock A and want to hedge it by shorting stock B. How many…
A: Correlation Coefficient The correlation may be a statistical measure of the strength of the link…
Q: How many different samples of size 3 (without replacement) can be taken from a finite population of…
A: Given: Population size N = 10 Sample size n = 3 Formula Used: Simple random sampling (Without…
Q: You wish to test the following claim (H₁) at a significance level of a = 0.05. Ho: P₁ = P2 Ha:pı >…
A: From the provided information, Level of significance (α) = 0.05
Q: Test statistic with p value also
A: Given that n = 818 , X = 517 Level of significance = 0.05
Q: -way ANOVA where there are k treatments and n observations, egrees of freedom for the F-statistic…
A: Given that K treatment and n observations.
Q: Consider the following random sample of data: 5, 10, 2, 4, 4, -4, -7, -5, 8, 84 a) What is the mean…
A:
Q: please use one or two variable analysis to solve
A: The data is Mass Frequency 6-11 4 12-17 6 18-23 5 24-29 3
Q: Problem 7 A casino offers people the chance to play the following game: flip two fair coins. If both…
A: Given information: Cost of the game = $1.25 per game If both heads come up heads, the gambler win…
Q: Number of times per week” is what type of data? a. qualitative b. quantitative discrete c.…
A: Given that Number of times per week
Q: The amount of time that people spend at Grover Hot Springs is normally distributed with a mean of 74…
A: From the provided information, Mean (µ) = 74 Standard deviation (σ) = 16 X~N (74, 16)
Q: 2. a) b) The following data shows the average length of new discovered species of worms code named…
A: Histogram is the graph used to plot the continuous frequency data. It helps to understand the shape…
A study was conducted to see whether heart rate (y) on swimmers linearly related to their age (x1) and swimming time for 2000 meters (x2). A random sample of ten swimmers was selected and the result is shown in the following Microsoft Excel output.
(a) | Interpret the value of R2 from the output. | |
(b) | Conduct a hypothesis test to test whether the linear regression model is fit or not using a = 0.05. | |
(c) | Calculate the 95% confidence interval for the coefficient value for age. | |
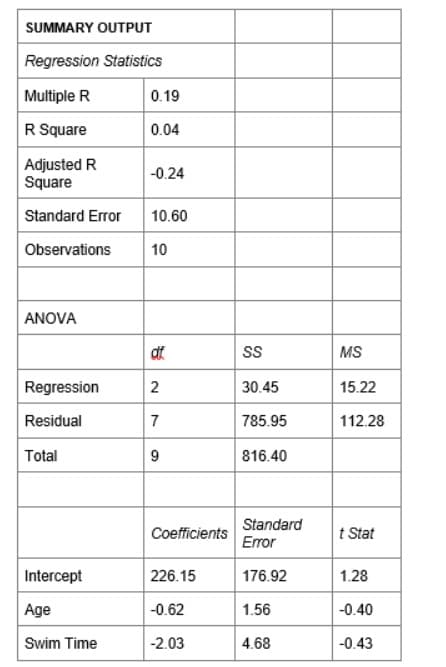
Step by step
Solved in 5 steps with 4 images
- Food deserts have become a particularly hot topic in the public health community as an explanation for a variety of negative health outcomes in disadvantaged areas. A researcher is interested in comparing the average shelf space provided by supermarkets, convenience stores, and corner stores in two different communities in order to address the growing concern for food deserts. Assume the following table reports the summary statistics for shelf space dedicated to fresh fruits and vegetables (meters) from SRSs of a variety of different stores that supply groceries from each community. Community Average shelf space for fresh fruits and vegetables (m) Sample standard deviation Sample size "Food desert" 13.7 2.4 12 Other community 89.4 14.6 14 A) Carry out the appropriate statistical test in order to determine if there is a significantdifference in mean shelf space between the two communities at the alpha level of 0.05. Assumeall conditions for the test are met. Do not assume…method and application in dealing with missing data and outlierTitle: Measures of variability: Grouped data activity
- Examination of large data sets to uncover hidden patterns is often referred to as: Data analytics, Analysis review procedures, Test of controls, Artificial analytical reviewProfitability remains a challenge for banks and thrifts with less than $2 billion of assets. The business problem facing a bank analyst relates to the factors that affect return on assets (ROA), an indicator of how profitable a company is relative to its total assets. Data collected from a sample of 194 community banks include the ROA (%), the efficiency ratio (%), as a measure of bank productivity (the lower the efficiency ratio, the better), and total risk-based capital (%), as a measure of capital adequacy. A multiple linear regression model resulted in an SSR of 5.25 and an SSE of 125.02. Calculate the test statistic. FSTAT=____________ (Round to two decimal places as needed.)Profitability remains a challenge for banks and thrifts with less than $2 billion of assets. The business problem facing a bank analyst relates to the factors that affect return on assets (ROA), an indicator of how profitable a company is relative to its total assets. Data collected from a sample of 194 community banks include the ROA (%), the efficiency ratio (%), as a measure of bank productivity (the lower the efficiency ratio, the better), and total risk-based capital (%), as a measure of capital adequacy. A multiple linear regression model resulted in an SSR of 5.25 and an SSE of 125.02. Determine the p-value. The p-value is _____ (Round to three decimal places as needed.)
- Profitability remains a challenge for banks and thrifts with less than $2 billion of assets. The business problem facing a bank analyst relates to the factors that affect return on assets (ROA), an indicator of how profitable a company is relative to its total assets. Data collected from a sample of 88 community banks include the ROA (%), the efficiency ratio (%), as a measure of bank productivity (the lower the efficiency ratio, the better), and total risk-based capital (%), as a measure of capital adequacy. Use the accompanying multiple linear regression results to complete parts (a) and (b) below. Variable Coefficient Standard Error t Statistic p-value Intercept −0.21762 0.39401 −0.55 0.5822 Efficiency Ratio, X1 0.01443 0.00498 2.90 0.0048 Risk-Based Capital, X2 0.04002 0.01034 3.87 0.0002 Determine the p-value for X1. p-value=________ (Type an integer or a decimal. Do not round.)Profitability remains a challenge for banks and thrifts with less than $2 billion of assets. The business problem facing a bank analyst relates to the factors that affect return on assets (ROA), an indicator of how profitable a company is relative to its total assets. Data collected from a sample of 88 community banks include the ROA (%), the efficiency ratio (%), as a measure of bank productivity (the lower the efficiency ratio, the better), and total risk-based capital (%), as a measure of capital adequacy. Use the accompanying multiple linear regression results to complete parts (a) and (b) below. Variable Coefficient Standard Error t Statistic p-value Intercept −0.21762 0.39401 −0.55 0.5822 Efficiency Ratio, X1 0.01443 0.00498 2.90 0.0048 Risk-Based Capital, X2 0.04002 0.01034 3.87 0.0002 a. Construct a 95% confidence interval estimate of the population slope between ROA and efficiency…Profitability remains a challenge for banks and thrifts with less than $2 billion of assets. The business problem facing a bank analyst relates to the factors that affect return on assets (ROA), an indicator of how profitable a company is relative to its total assets. Data collected from a sample of 88 community banks include the ROA (%), the efficiency ratio (%), as a measure of bank productivity (the lower the efficiency ratio, the better), and total risk-based capital (%), as a measure of capital adequacy. Use the accompanying multiple linear regression results to complete parts (a) and (b) below. Variable Coefficient Standard Error t Statistic p-value Intercept −0.21762 0.39401 −0.55 0.5822 Efficiency Ratio, X1 0.01443 0.00498 2.90 0.0048 Risk-Based Capital, X2 0.04002 0.01034 3.87 0.0002 Find the test statistic for X1. tSTAT=______ (Type an integer or a decimal. Do not round.)
- Joan's Nursery specializes in custom-designed landscaping for residential areas. The estimated labor cost associated with a particular landscaping proposal is based on the number of plantings of trees, shrubs, and so on to be used for the project. For cost-estimating purposes, managers use two hours of labor time for the planting of a medium-sized tree. Actual times from a sample of 10 plantings during the past month follow (times in hours).apply visual and descriptive analytics to summarize the data for italy. Use this to draw any initial conclusion date total_cases new_cases total_deaths new_deaths 12/31/2019 0 0 0 0 1/1/2020 0 0 0 0 1/2/2020 0 0 0 0 1/3/2020 0 0 0 0 1/4/2020 0 0 0 0 1/5/2020 0 0 0 0 1/6/2020 0 0 0 0 1/7/2020 0 0 0 0 1/8/2020 0 0 0 0 1/9/2020 0 0 0 0 1/10/2020 0 0 0 0 1/11/2020 0 0 0 0 1/12/2020 0 0 0 0 1/13/2020 0 0 0 0 1/14/2020 0 0 0 0 1/15/2020 0 0 0 0 1/16/2020 0 0 0 0 1/17/2020 0 0 0 0 1/18/2020 0 0 0 0 1/19/2020 0 0 0 0 1/20/2020 0 0 0 0 1/21/2020 0 0 0 0 1/22/2020 0 0 0 0 1/23/2020 0 0 0 0 1/24/2020 0 0 0 0 1/25/2020 0 0 0 0 1/26/2020 0 0 0 0 1/27/2020 0 0 0 0 1/28/2020 0 0 0 0 1/29/2020 0 0 0 0 1/30/2020 0 0 0 0 1/31/2020 3 3 0 0 2/1/2020 3 0 0 0 2/2/2020 3 0 0 0 2/3/2020 3 0 0 0 2/4/2020 3 0 0 0 2/5/2020 3 0 0 0 2/6/2020 3 0 0 0 2/7/2020 3 0 0 0 2/8/2020 3 0 0 0 2/9/2020 3 0 0 0 2/10/2020 3 0 0 0 2/11/2020…Chest Injury Rating Car Driver Passenger Car Driver Passenger 1 42 35 10 36 37 2 42 35 11 36 37 3 34 45 12 43 58 4 34 45 13 40 42 5 45 45 14 43 58 6 40 42 15 37 41 7 42 46 16 37 41 8 43 58 17 44 57 9 45 43 18 42 42 Generate test results (α = .01) using data analysis (EXCEL).